

Trehalose-mediated inhibition of the plasma membrane H+-ATPase from Kluyveromyces lactis: dependence on viscosity and temperature
- PMID: 12142408
- PMCID: PMC135241
- DOI: 10.1128/JB.184.16.4384-4391.2002
Trehalose-mediated inhibition of the plasma membrane H+-ATPase from Kluyveromyces lactis: dependence on viscosity and temperature
Abstract
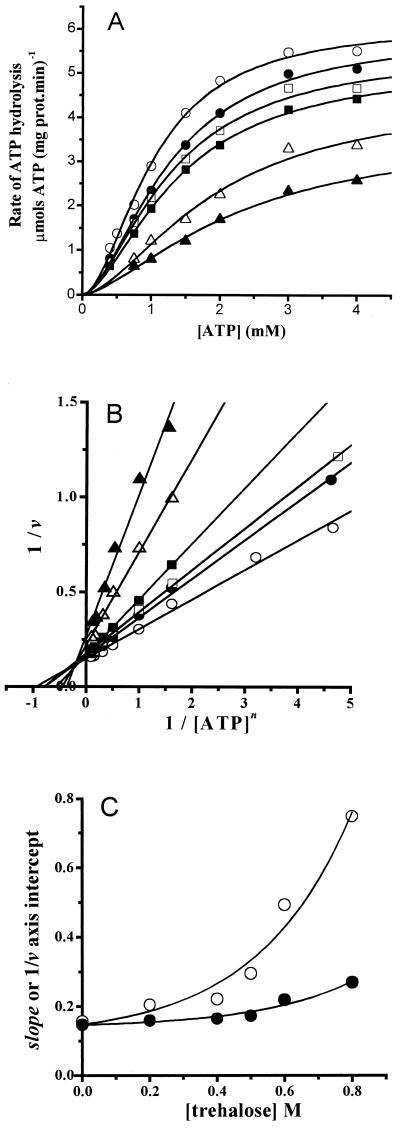
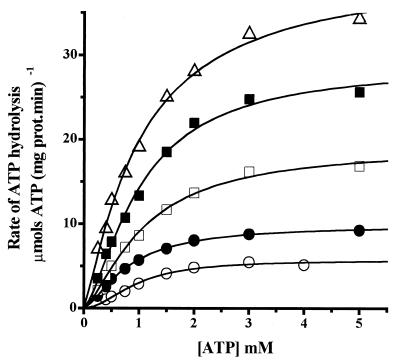
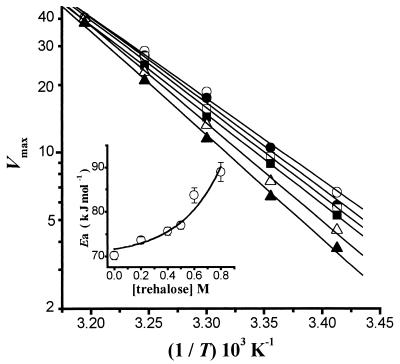
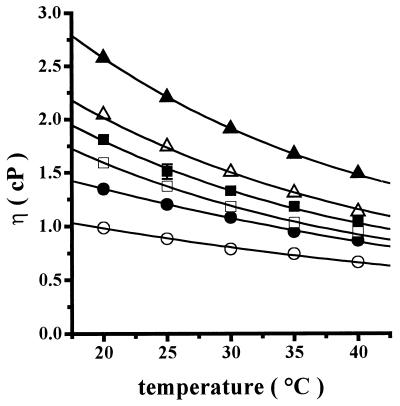
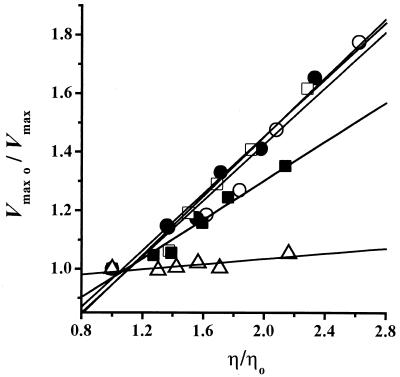
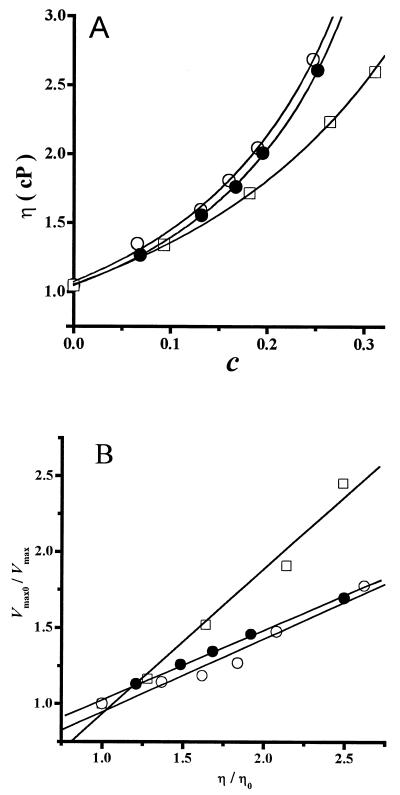
The effect of increasing trehalose concentrations on the kinetics of the plasma membrane H+-ATPase from Kluyveromyces lactis was studied at different temperatures. At 20 degrees C, increasing concentrations of trehalose (0.2 to 0.8 M) decreased V(max) and increased S(0.5) (substrate concentration when initial velocity equals 0.5 V(max)), mainly at high trehalose concentrations (0.6 to 0.8 M). The quotient V(max)/S(0.5) decreased from 5.76 micromol of ATP mg of protein(-1) x min(-1) x mM(-1) in the absence of trehalose to 1.63 micromol of ATP mg of protein(-1) x min(-1) x mM(-1) in the presence of 0.8 M trehalose. The decrease in V(max) was linearly dependent on solution viscosity (eta), suggesting that inhibition was due to hindering of protein domain diffusional motion during catalysis and in accordance with Kramer's theory for reactions in solution. In this regard, two other viscosity-increasing agents, sucrose and glycerol, behaved similarly, exhibiting the same viscosity-enzyme inhibition correlation predicted. In the absence of trehalose, increasing the temperature up to 40 degrees C resulted in an exponential increase in V(max) and a decrease in enzyme cooperativity (n), while S(0.5) was not modified. As temperature increased, the effect of trehalose on V(max) decreased to become negligible at 40 degrees C, in good correlation with the temperature-mediated decrease in viscosity. The trehalose-mediated increase in S(0.5) was similar at all temperatures tested, and thus, trehalose effects on V(max)/S(0.5) were always observed. Trehalose increased the activation energy for ATP hydrolysis. Trehalose-mediated inhibition of enzymes may explain why yeast rapidly hydrolyzes trehalose when exiting heat shock.
Figures

Similar articles
-
Measuring Solution Viscosity and its Effect on Enzyme Activity.Biol Proced Online. 2003;5:108-115. doi: 10.1251/bpo52. Epub 2003 May 1. Biol Proced Online. 2003. PMID: 14569610 Free PMC article.
-
Thermal inactivation of the plasma membrane H+-ATPase from Kluyveromyces lactis. Protection by trehalose.Biochim Biophys Acta. 2001 Jan 12;1544(1-2):64-73. doi: 10.1016/s0167-4838(00)00205-3. Biochim Biophys Acta. 2001. PMID: 11341917
-
Trehalose-mediated protection of the plasma membrane H+-ATPase from Kluyveromyces lactis during freeze-drying and rehydration.Cryobiology. 1998 Sep;37(2):131-8. doi: 10.1006/cryo.1998.2109. Cryobiology. 1998. PMID: 9769163
-
The heat shock and ethanol stress responses of yeast exhibit extensive similarity and functional overlap.FEMS Microbiol Lett. 1995 Dec 15;134(2-3):121-7. doi: 10.1111/j.1574-6968.1995.tb07925.x. FEMS Microbiol Lett. 1995. PMID: 8586257 Review.
-
Vacuolar and plasma membrane proton-adenosinetriphosphatases.Physiol Rev. 1999 Apr;79(2):361-85. doi: 10.1152/physrev.1999.79.2.361. Physiol Rev. 1999. PMID: 10221984 Review.
Cited by
-
The natural osmolyte trehalose is a positive regulator of the heat-induced activity of yeast heat shock transcription factor.Mol Cell Biol. 2007 Feb;27(4):1505-15. doi: 10.1128/MCB.01158-06. Epub 2006 Dec 4. Mol Cell Biol. 2007. PMID: 17145780 Free PMC article.
-
Crystal structure and functional characterization of an oligosaccharide dehydrogenase from Pycnoporus cinnabarinus provides insights into fungal breakdown of lignocellulose.Biotechnol Biofuels. 2021 Jul 22;14(1):161. doi: 10.1186/s13068-021-02003-y. Biotechnol Biofuels. 2021. PMID: 34294139 Free PMC article.
-
Mapping the ATP binding site in the plasma membrane H(+)-ATPase from Kluyveromyces lactis.J Fluoresc. 2014 Nov;24(6):1849-59. doi: 10.1007/s10895-014-1473-1. Epub 2014 Oct 28. J Fluoresc. 2014. PMID: 25345860
-
Measuring Solution Viscosity and its Effect on Enzyme Activity.Biol Proced Online. 2003;5:108-115. doi: 10.1251/bpo52. Epub 2003 May 1. Biol Proced Online. 2003. PMID: 14569610 Free PMC article.
-
Isolation of the Sarcoplasmic Reticulum Ca2+-ATPase from Rabbit Fast-Twitch Muscle.Methods Protoc. 2023 Oct 19;6(5):102. doi: 10.3390/mps6050102. Methods Protoc. 2023. PMID: 37888034 Free PMC article.
References
-
- Aflalo, C. 1997. Localized firefly luciferase probes ATP at the surface of mitochondria. J. Bioenerg. Biomembr. 29:549-559. - PubMed
-
- Anderson, K. W., and A. J. Murphy. 1983. Alterations in the structure of the ribose moiety of ATP reduce its effectiveness as a substrate for the sarcoplasmic reticulum ATPase. J. Biol. Chem. 258:14276-14278. - PubMed
-
- Bowman, B. J., and C. W. Slayman. 1979. The effects of vanadate on the plasma membrane ATPase of Neurospora crassa. J. Biol. Chem. 254:2928-2934. - PubMed
-
- Coote, P. J., M. V. Jones, I. J. Seymour, D. L. Rowe, D. P. Ferdinando, A. J. McArthur, and M. B. Cole. 1994. Activity of the plasma membrane H+-ATPase is a key physiological determinant of thermotolerance in Saccharomyces cerevisiae. Microbiology 140:1881-1890. - PubMed
Publication types
MeSH terms
Substances
LinkOut - more resources
Full Text Sources
Research Materials
Miscellaneous
