

The nptA gene of Vibrio cholerae encodes a functional sodium-dependent phosphate cotransporter homologous to the type II cotransporters of eukaryotes
- PMID: 12142417
- PMCID: PMC135239
- DOI: 10.1128/JB.184.16.4466-4474.2002
The nptA gene of Vibrio cholerae encodes a functional sodium-dependent phosphate cotransporter homologous to the type II cotransporters of eukaryotes
Abstract
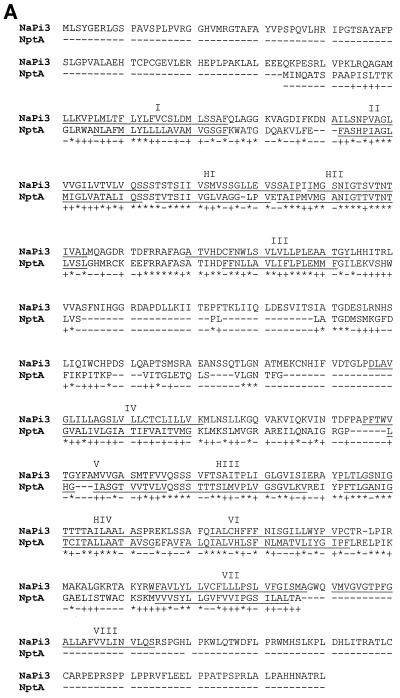
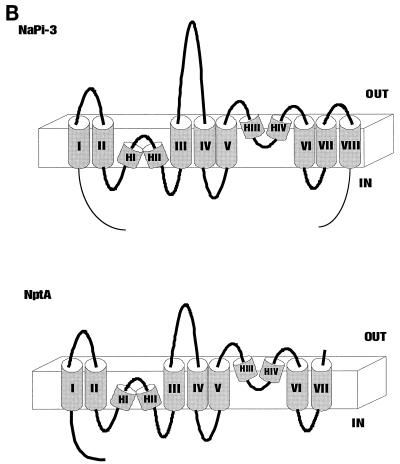
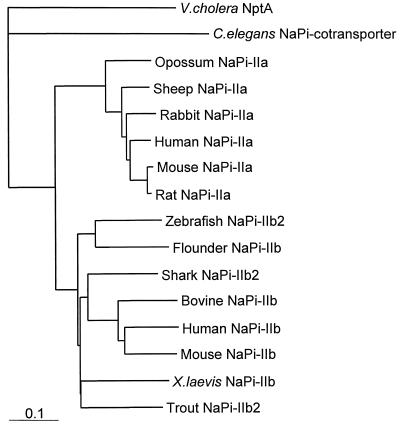
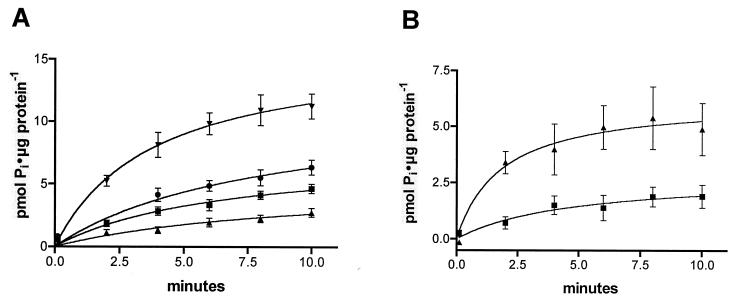
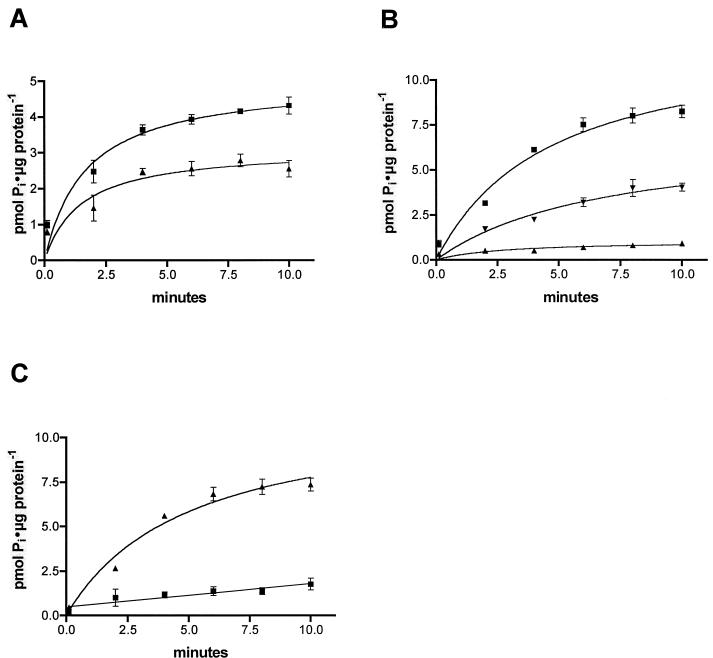
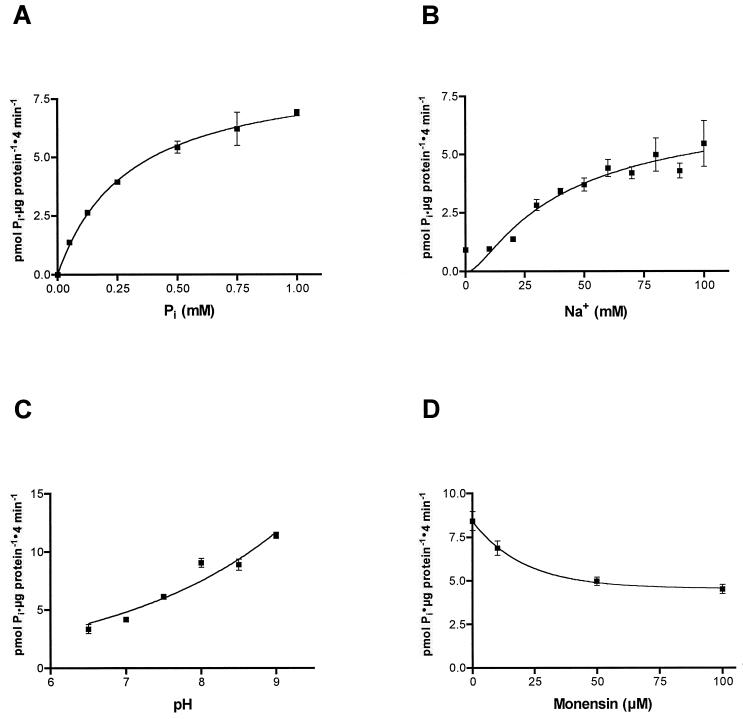
The nptA gene of Vibrio cholerae has significant protein sequence homology with type II sodium-dependent phosphate (P(i)) cotransporters found in animals but not previously identified in prokaryotes. The phylogeny of known type II cotransporter sequences indicates that nptA may be either an ancestral gene or a gene acquired from a higher eukaryotic source. The gene was cloned into an expression vector under the control of an inducible promoter and expressed in Escherichia coli. The results demonstrate that nptA encodes a functional protein with activity similar to that of the animal enzyme, catalyzing high-affinity, sodium-dependent P(i) uptake with comparable affinities for both sodium and phosphate ions. Furthermore, the activity of NptA is influenced by pH, again in a manner similar to that of the NaPi-2a subtype of the animal enzyme, although it lacks the corresponding REK motif thought to be responsible for this phenomenon. P(i) uptake activity, a component of which appeared to be sodium dependent, was increased in V. cholerae by phosphate starvation. However, it appears from the use of a reporter gene expressed from the nptA promoter that none of this activity is attributable to the induction of expression from nptA. It is thus proposed that the physiological function of NptA protein may be the rapid uptake of P(i) in preparation for rapid growth in nutrient-rich environments and that it may therefore play a role in establishing infection.
Figures
Similar articles
-
Characterization of a type IIb sodium-phosphate cotransporter from zebrafish (Danio rerio) kidney.Am J Physiol Renal Physiol. 2003 Apr;284(4):F727-36. doi: 10.1152/ajprenal.00356.2002. Epub 2002 Dec 17. Am J Physiol Renal Physiol. 2003. PMID: 12488247
-
Evolution of the Na-P(i) cotransport systems.Am J Physiol Regul Integr Comp Physiol. 2001 Feb;280(2):R301-12. doi: 10.1152/ajpregu.2001.280.2.R301. Am J Physiol Regul Integr Comp Physiol. 2001. PMID: 11208556 Review.
-
Functional expression and characterization of the wild-type mammalian renal cortex sodium/phosphate cotransporter and an 215R mutant in Saccharomyces cerevisiae.Biochemistry. 1999 Oct 12;38(41):13551-9. doi: 10.1021/bi991414b. Biochemistry. 1999. PMID: 10521262
-
Differential expression of a sodium-phosphate cotransporter among Vibrio vulnificus strains.Microb Ecol. 2014 Jan;67(1):24-33. doi: 10.1007/s00248-013-0300-6. Epub 2013 Oct 20. Microb Ecol. 2014. PMID: 24141939
-
Renal Na/Pi-cotransporters.Kidney Int. 1996 Apr;49(4):981-5. doi: 10.1038/ki.1996.139. Kidney Int. 1996. PMID: 8691748 Review.
Cited by
-
Acquisition of the Phosphate Transporter NptA Enhances Staphylococcus aureus Pathogenesis by Improving Phosphate Uptake in Divergent Environments.Infect Immun. 2017 Dec 19;86(1):e00631-17. doi: 10.1128/IAI.00631-17. Print 2018 Jan. Infect Immun. 2017. PMID: 29084897 Free PMC article.
-
Physiological Roles of the Dual Phosphate Transporter Systems in Low and High Phosphate Conditions and in Capsule Maintenance of Streptococcus pneumoniae D39.Front Cell Infect Microbiol. 2016 Jun 20;6:63. doi: 10.3389/fcimb.2016.00063. eCollection 2016. Front Cell Infect Microbiol. 2016. PMID: 27379215 Free PMC article.
-
Coordination of Phosphate and Magnesium Metabolism in Bacteria.Adv Exp Med Biol. 2022;1362:135-150. doi: 10.1007/978-3-030-91623-7_12. Adv Exp Med Biol. 2022. PMID: 35288878
-
Transposon mutagenesis identified chromosomal and plasmid genes essential for adaptation of the marine bacterium Dinoroseobacter shibae to anaerobic conditions.J Bacteriol. 2013 Oct;195(20):4769-77. doi: 10.1128/JB.00860-13. Epub 2013 Aug 23. J Bacteriol. 2013. PMID: 23974024 Free PMC article.
-
Predicting Species-Resolved Macronutrient Acquisition during Succession in a Model Phototrophic Biofilm Using an Integrated 'Omics Approach.Front Microbiol. 2017 Jun 13;8:1020. doi: 10.3389/fmicb.2017.01020. eCollection 2017. Front Microbiol. 2017. PMID: 28659875 Free PMC article.
References
-
- Ames, G. F.-L. 1986. Bacterial periplasmic transport systems: structure, mechanism and evolution. Annu. Rev. Biochem. 55:397-426. - PubMed
-
- Ausubel, F. A., R. Brent, R. E. Kingston, D. D. Moore, J. G. Seidman, J. A. Smith, and K. Struhl. 1998. Current protocols in molecular biology. John Wiley & Sons, New York, N.Y.
-
- Bartilson, M., and V. Shingler. 1989. Nucleotide sequence of the catechol 2,3 dioxygenase encoding gene of phenol-catabolizing Pseudomonas CF600. Gene 85:233-238. - PubMed
-
- Biber, J., M. Custer, S. Magagnin, G. Hayes, A. Werner, M. Lötscher, B. Kaissling, and H. Murer. 1996. Renal Na/Pi-cotransporters. Kidney Int. 49:981-985. - PubMed
Publication types
MeSH terms
Substances
Associated data
- Actions
LinkOut - more resources
Full Text Sources
Molecular Biology Databases
Research Materials
Miscellaneous
