Docking of protein models
- PMID: 12142443
- PMCID: PMC2373684
- DOI: 10.1110/ps.4730102
Docking of protein models
Abstract
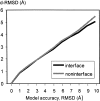
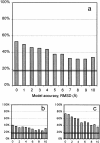
An adequate description of entire genomes has to include information on the three-dimensional (3D) structure of proteins. Most of these protein structures will be determined by high-throughput modeling procedures. Thus, a structure-based analysis of the network of protein-protein interactions in genomes requires docking methodologies that are capable of dealing with significant structural inaccuracies in the modeled structures of proteins. We present a systematic study of the applicability of our low-resolution docking method to protein models of different accuracies. A representative nonredundant set of 475 cocrystallized protein-protein complexes was used to build an array of models of each protein in the set. A sophisticated procedure was created to generate the models with RMS deviations of 1, 2, 3,., 10 A from the crystal structure. The docking was performed for all the models, and the predictions were compared with the configurations of the original cocrystallized complexes. Statistical analysis showed that the low-resolution docking can determine the gross structural features of protein-protein interactions for a significant percent of complexes of highly inaccurate protein models. Such predictions may serve as starting points for a more detailed structural analysis, as well as complement experimental and computational data on protein-protein interactions obtained by other techniques.
Figures


Similar articles
-
DOCKGROUND system of databases for protein recognition studies: unbound structures for docking.Proteins. 2007 Dec 1;69(4):845-51. doi: 10.1002/prot.21714. Proteins. 2007. PMID: 17803215
-
Docking of small ligands to low-resolution and theoretically predicted receptor structures.J Comput Chem. 2002 Jan 15;23(1):189-97. doi: 10.1002/jcc.1165. J Comput Chem. 2002. PMID: 11913386
-
Assessment of blind predictions of protein-protein interactions: current status of docking methods.Proteins. 2003 Jul 1;52(1):51-67. doi: 10.1002/prot.10393. Proteins. 2003. PMID: 12784368
-
Importance of molecular computer modeling in anticancer drug development.J BUON. 2007 Sep;12 Suppl 1:S101-18. J BUON. 2007. PMID: 17935268 Review.
-
Accounting for conformational changes during protein-protein docking.Curr Opin Struct Biol. 2010 Apr;20(2):180-6. doi: 10.1016/j.sbi.2010.02.001. Epub 2010 Mar 1. Curr Opin Struct Biol. 2010. PMID: 20194014 Review.
Cited by
-
Protein models: the Grand Challenge of protein docking.Proteins. 2014 Feb;82(2):278-87. doi: 10.1002/prot.24385. Epub 2013 Oct 17. Proteins. 2014. PMID: 23934791 Free PMC article.
-
Identification of the antiepileptic racetam binding site in the synaptic vesicle protein 2A by molecular dynamics and docking simulations.Front Cell Neurosci. 2015 Apr 10;9:125. doi: 10.3389/fncel.2015.00125. eCollection 2015. Front Cell Neurosci. 2015. PMID: 25914622 Free PMC article.
-
GWIDD: a comprehensive resource for genome-wide structural modeling of protein-protein interactions.Hum Genomics. 2012 Jul 11;6(1):7. doi: 10.1186/1479-7364-6-7. Hum Genomics. 2012. PMID: 23245398 Free PMC article. Review.
-
Protein docking by the interface structure similarity: how much structure is needed?PLoS One. 2012;7(2):e31349. doi: 10.1371/journal.pone.0031349. Epub 2012 Feb 13. PLoS One. 2012. PMID: 22348074 Free PMC article.
-
In silico pathway reconstruction: Iron-sulfur cluster biogenesis in Saccharomyces cerevisiae.BMC Syst Biol. 2007 Jan 31;1:10. doi: 10.1186/1752-0509-1-10. BMC Syst Biol. 2007. PMID: 17408500 Free PMC article.
References
-
- Bridges, A., Gruenke, L., Chang, Y.-T., Vakser, I.A., Loew, G., and Waskell, L. 1998. Identification of the binding site on cytochrome p450 2b4 for cytochrome b5 and cytochrome p450 reductase. J. Biol. Chem. 273 17036–17049. - PubMed
-
- Burley, S.K. 2000. An overview of structural genomics. Nat. Struct. Biol. 7 932–934. - PubMed
-
- Chang, Y.-T., Stiffelman, O.B., Vakser, I.A., Loew, G.H., Bridges, A., and Waskell, L. 1997. Construction of a 3D model of cytochrome p450 2b4. Protein Eng. 10 119–129. - PubMed
-
- Eisenberg, D., Marcotte, E.M., Xenarios, I., and Yeates, T.O. 2000. Protein function in the post-genomic era. Nature 405 823–826. - PubMed
-
- Jones, T.A. and Kleywegt, G.J. 1999. CASP3 comparative modeling evaluation. Proteins Suppl. 3 30–46. - PubMed
Publication types
MeSH terms
Substances
Grants and funding
LinkOut - more resources
Full Text Sources
Other Literature Sources

