. 2002 Aug;11(8):1937-44.
doi: 10.1110/ps.3790102.

Contact order and ab initio protein structure prediction

Affiliations

Contact order and ab initio protein structure prediction

Richard Bonneau et al. Protein Sci. 2002 Aug.

Abstract

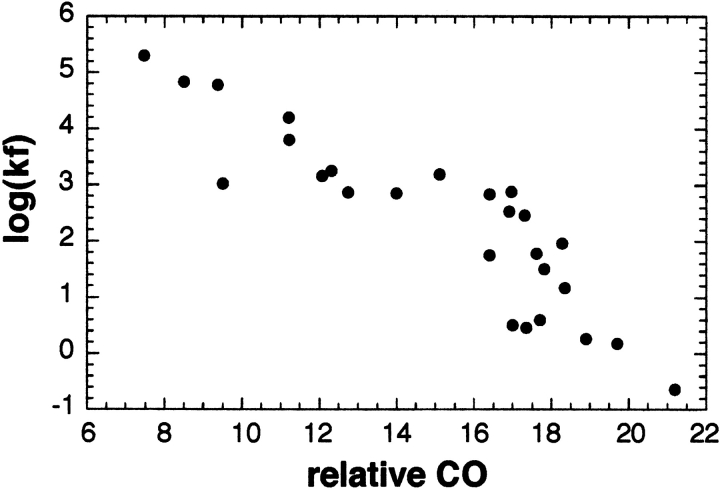
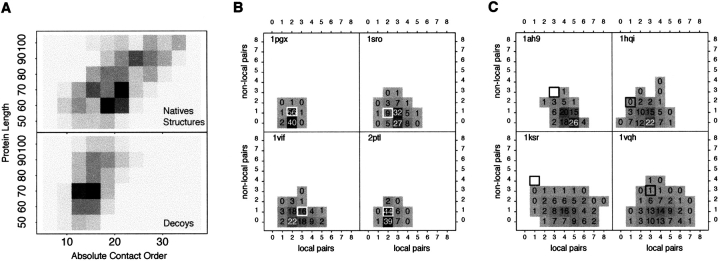
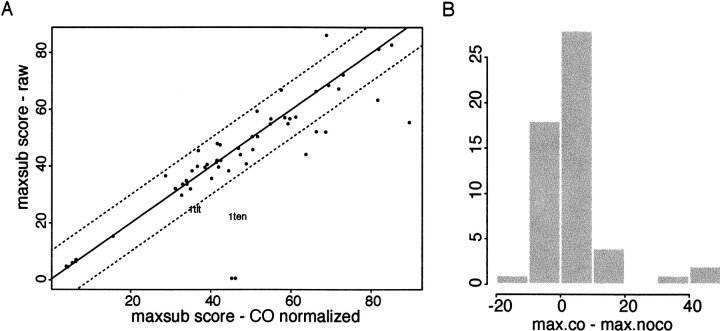
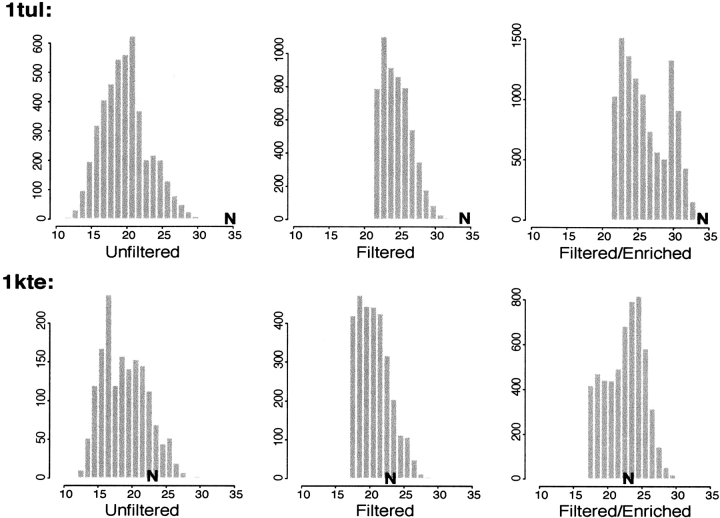
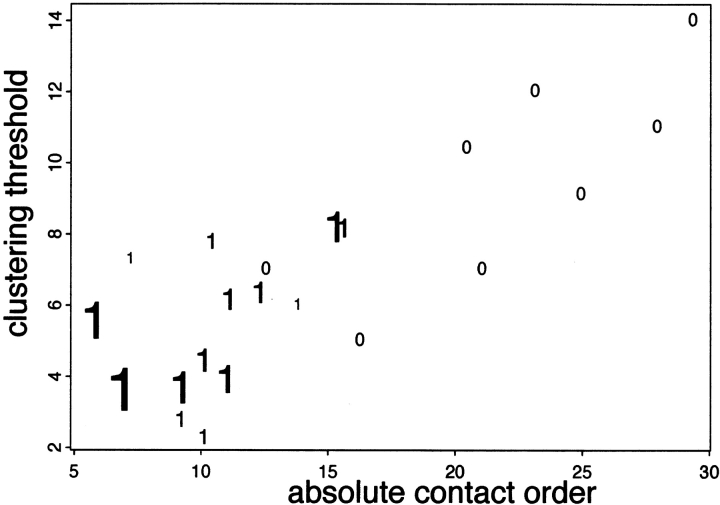
Although much of the motivation for experimental studies of protein folding is to obtain insights for improving protein structure prediction, there has been relatively little connection between experimental protein folding studies and computational structural prediction work in recent years. In the present study, we show that the relationship between protein folding rates and the contact order (CO) of the native structure has implications for ab initio protein structure prediction. Rosetta ab initio folding simulations produce a dearth of high CO structures and an excess of low CO structures, as expected if the computer simulations mimic to some extent the actual folding process. Consistent with this, the majority of failures in ab initio prediction in the CASP4 (critical assessment of structure prediction) experiment involved high CO structures likely to fold much more slowly than the lower CO structures for which reasonable predictions were made. This bias against high CO structures can be partially alleviated by performing large numbers of additional simulations, selecting out the higher CO structures, and eliminating the very low CO structures; this leads to a modest improvement in prediction quality. More significant improvements in predictions for proteins with complex topologies may be possible following significant increases in high-performance computing power, which will be required for thoroughly sampling high CO conformations (high CO proteins can take six orders of magnitude longer to fold than low CO proteins). Importantly for such a strategy, simulations performed for high CO structures converge much less strongly than those for low CO structures, and hence, lack of simulation convergence can indicate the need for improved sampling of high CO conformations. The parallels between Rosetta simulations and folding in vivo may extend to misfolding: The very low CO structures that accumulate in Rosetta simulations consist primarily of local up-down beta-sheets that may resemble precursors to amyloid formation.


Figures

Fig. 1.
Fig. 1.
Correlation between relative contact order (CO) and folding rate. The relative CO is plotted against the log folding rate for proteins with structures known to fold via single exponential kinetics (Plaxco et al. 1998; Grantcharova et al. 2001).
Fig. 2.
Fig. 2.
Comparison of absolute contact order (CO) distributions of native and simulated structures. (A) The CO distribution of native structures (top) and 152,000 decoys (bottom) generated for 152 proteins using Rosetta for different length ranges (y–axis). Absolute CO was used here rather than relative CO because it more clearly differentiates the native and decoy populations. Because Rosetta decoys do not have explicit side–chains, two residues are considered contacting if their β–carbons are within 8 Å. To avoid biases from the fragment libraries, contacts between residues closer than three sequence positions apart were discounted from the calculation. (B) Two–dimensional histograms of the number of local and nonlocal strand pairings found in Rosetta decoy populations for four relatively local proteins are shown. The numbers superimposed on the boxes correspond to the percentage of decoys in the population of decoys generated for each protein that have that combination of local and nonlocal pairings. The pattern of strand pairing found in the correct native structure for each protein is indicated by a box surrounding the correct bin. Notice that for these four simulations, the native structure falls well within the CO distribution. (C) Same as in B for decoy populations for four proteins with higher CO topologies. The native structures (indicated by black boxes) now fall in sparsely populated or unpopulated regions of the decoy CO distribution, illustrating the need for correcting the systematic CO bias of Rosetta when folding more nonlocal proteins.
Fig. 3.
Fig. 3.
Performance of Rosetta with contact order (CO) filtering. Rosetta simulations were performed for 54 proteins, the conformations with COs lower than that seen in 95% of proteins of similar length and secondary structure class were discarded, and approximately one order of magnitude of more computer time was used to generate additional high CO conformations. The quality of these CO–normalized (filtered and enriched with respect to CO) populations are compared to populations of equal numbers of unfiltered decoy conformations. (A) The similarity to the native structure of the top 10 cluster centers for each protein obtained, both with and without this normalization of the CO distribution, was assessed using MaxSub (Siew et al. 2000). The higher the MaxSub score, the more superimposable a predicted structure is on the native structure. The score is highly correlated with the length of the correctly predicted region for a given prediction and was shown at CASP3 (critical assessment of structure prediction) to reproduce the rankings given to predictions by experts in the field (Siew et al. 2000). The y–axis in the figure is the highest MaxSub score obtained for any of the top 10 cluster centers without CO renormalization; the x–axis is the highest MaxSub score obtained after CO renormalization (2000 conformations were clustered in both cases). The improvements evident for seven of the proteins in the bottom right of the figure are quite large: Before CO normalization, 1kte (far right) was predicted to within 5.5 Å over 75 residues; after CO normalization, 99 residues were predicted to 2.9 Å root mean square deviation (RMSD). For two proteins (1dun and 1c1l; bottom of plot) Rosetta did not converge at all before CO filtering but produced models with 64 of 120 residues predicted with an RMSD of 5.5 Å and 55 of 136 residues predicted at 4.4 Å RMSD. (B) The improvement in MaxSub score obtained for the CO–normalized populations in part A is shown as a histogram.
Fig. 4.
Fig. 4.
Contact order (CO) distributions for filtered and unfiltered decoy populations: For both proteins, the CO of the native protein is indicated on all histograms by a bold "N." Unfiltered indicates standard populations of Rosetta decoys; filtered, populations for which the lower cutoff (shown in Fig. 6 ▶) was applied to remove overly local conformations; and filtered/enriched, populations filtered with the lower CO filter and then enriched with respect to higher CO bins with approximately one order of magnitude more sampling. (Top). The unfiltered CO distribution (left) for 1tul shows that the CO distribution is clearly below what is seen for β–proteins ∼100 residues in length. The minimal filter rids the population of overly local structures but leaves the high CO region near the native state relatively undersampled (middle). The filtered and enriched population still leaves the native–like high CO region of the distribution minimally sampled, and clustering this population produces incorrect fold predictions. (Bottom) The upper tail of the unfiltered CO distribution for 1kte (left) encompasses the native state, but attempts to cluster this protein nevertheless produce overly local, incorrect, cluster centers. The enriched–filtered population (bottom right) is well sampled in the native–like regions of the CO distribution, and clustering this filtered enriched population results in correct top ranked clusters.
Fig. 5.
Fig. 5.
Contact order (CO) and CASP4 (critical assessment of structure prediction) predictions. The correlation between CO and clustering threshold for CASP4 predictions. The clustering threshold is the root mean square deviation (in Å) of the largest cluster; thus, the smaller the clustering threshold, the more tightly Rosetta converged. Targets for which our best submitted models had significant portions predicted to within 6.5 Å are shown as "1"; targets for which our predictions were incorrect are indicated as zeros. The size of the "1s" are proportional to the Dali Zscore between the best model and the correct native, thus larger "1s" indicate stronger successes. Simulations for most proteins with lower CO native structures converged on correct models, whereas simulations for most high CO proteins were less converged and resulted in incorrect models.
Fig. 6.
Fig. 6.
Contact order (CO)–length distribution for native proteins. The CO is plotted against length for a nonredundant set of proteins with lengths between 50 and 160 residues in length for three secondary structure classes. Length–dependent CO bins are defined by the three lines present in each plot. The region below the bottom–most line contains 5% of native proteins. The middle line separates the upper 50% CO bin from the lower 50% bin, whereas the top line delimits the upper 5% CO bin. These defining lines were fit to the data as described in Materials and Methods.

Similar articles

Cited by

References

    1. Baldwin, R.L. and Rose, G.D. 1999. Is protein folding hierarchic? II: Folding intermediates and transition states. Trends Biochem. Sci. 24 77–83. - PubMed
    1. Bonneau, R., Strauss, C.E.M., and Baker, D. 2001. Improving the performance of ROSETTA using multiple sequence alignment information and global measures of hydrophobic core formation. Proteins 43 1–11. - PubMed
    1. Bonneau, R., Tsai, J., Ruczinski, I., and Baker, D. 2001a. Functional inferences from blind ab initio protein structure predictions. J. Struct. Biol. 134 186–190. - PubMed
    1. Bonneau, R, Tsai, J., Ruczinski, I., Chivian, D., Rohl, C., Strauss, C.E.M., and Baker, D. 2001b. Rosetta in CASP4: Progress in ab initio protein structure prediction. Proteins 45 119–126. - PubMed
    1. Bowers, P.M., Strauss, C.E., and Baker, D. 2000. De novo protein structure determination using sparse NMR data. J. Biomol. NMR 18 311–318. - PubMed

Publication types