

Fast-folding protein kinetics, hidden intermediates, and the sequential stabilization model
- PMID: 12142450
- PMCID: PMC2373683
- DOI: 10.1110/ps.0207102
Fast-folding protein kinetics, hidden intermediates, and the sequential stabilization model
Abstract
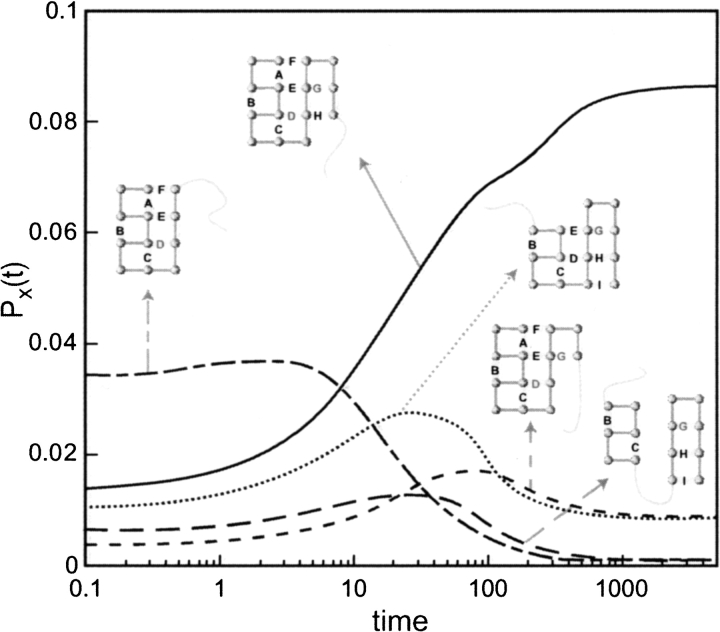
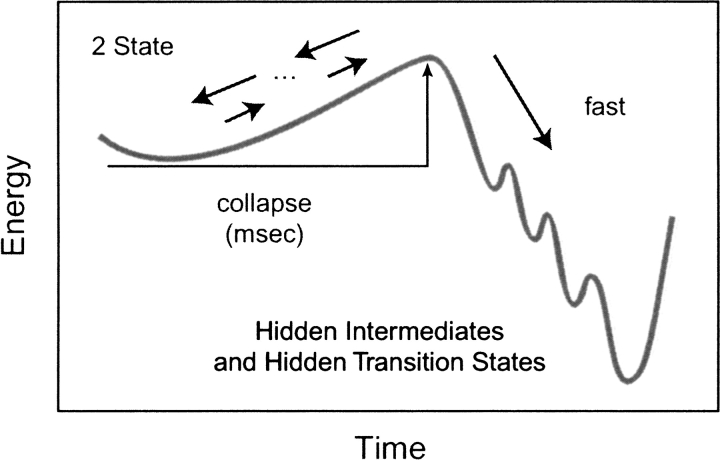
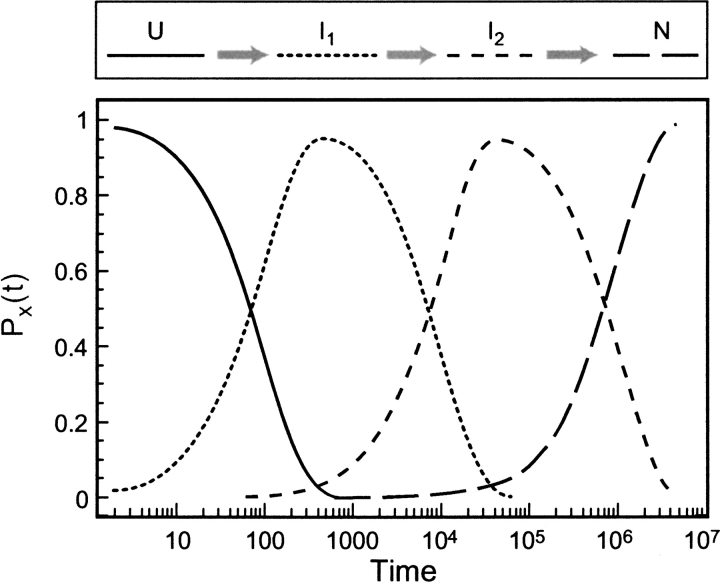
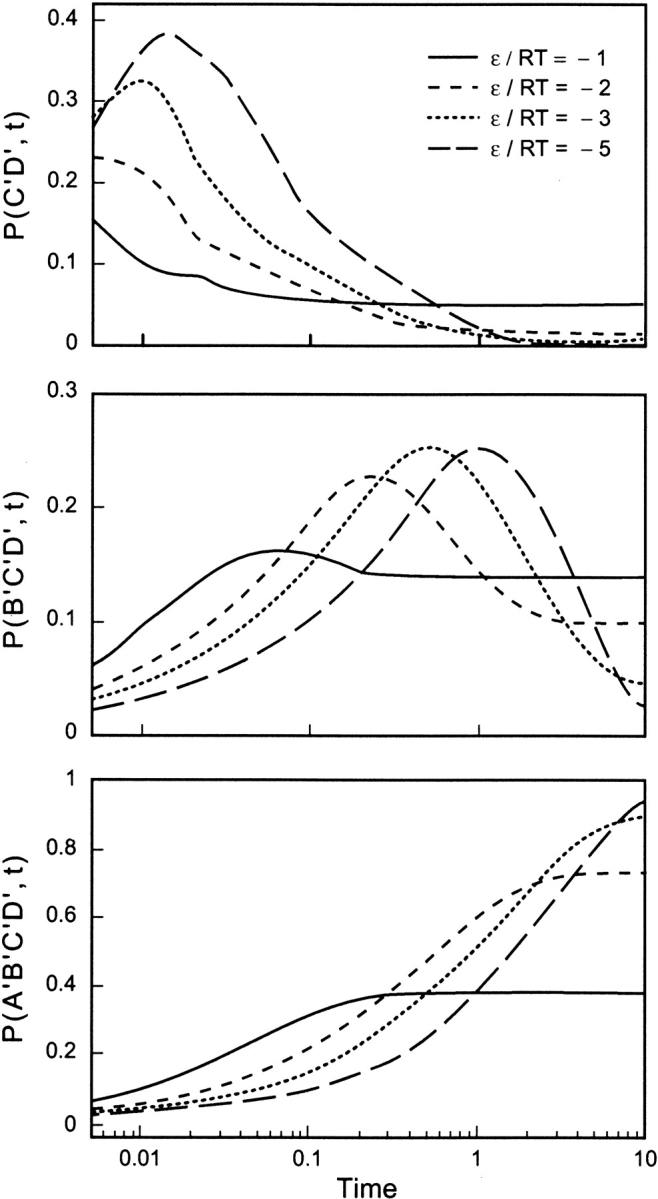
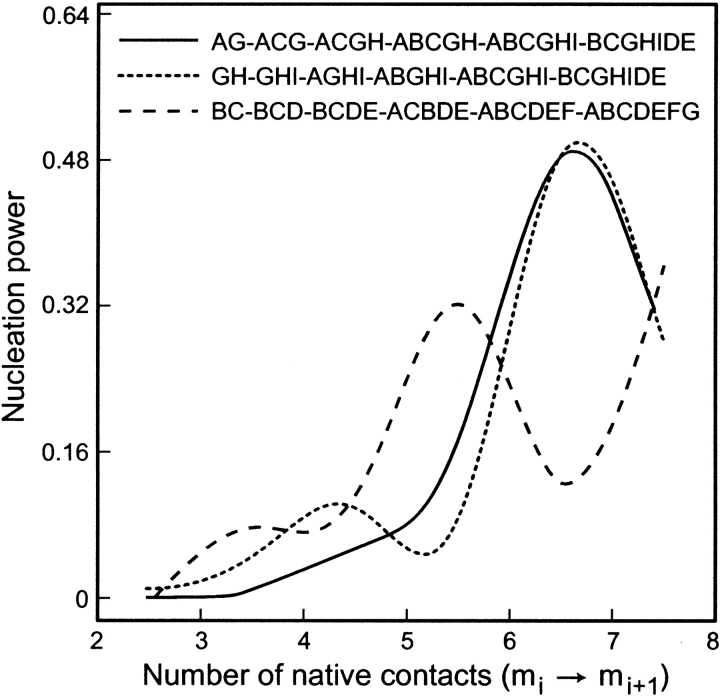
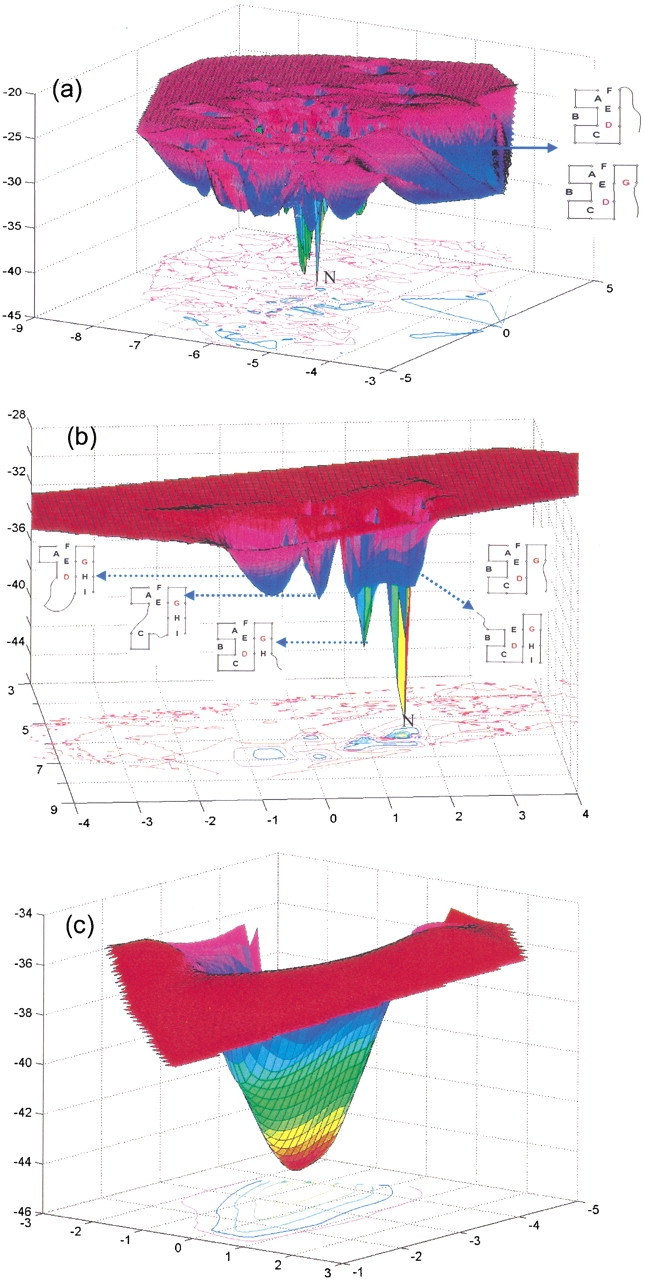
Do two-state proteins fold by pathways or funnels? Native-state hydrogen exchange experiments show discrete nonnative structures in equilibrium with the native state. These could be called hidden intermediates (HI) because their populations are small at equilibrium, and they are not detected in kinetic experiments. HIs have been invoked as disproof of funnel models, because funnel pictures appear to indicate (1) no specific sequences of events in folding; (2) a continuum, rather than a discrete ladder, of structures; and (3) smooth landscapes. In the present study, we solve the exact dynamics of a simple model. We find, instead, that the present microscopic model is indeed consistent with HIs and transition states, but such states occur in parallel, rather than along the single pathway predicted by the sequential stabilization model. At the microscopic level, we observe a huge multiplicity of trajectories. But at the macroscopic level, we observe two pathways of specific sequences of events that are relatively traditional except that they are in parallel, so there is not a single reaction coordinate. Using singular value decomposition, we show an accurate representation of the shapes of the model energy landscapes. They are highly complex funnels.
Figures
Similar articles
-
Computing the transition state populations in simple protein models.Biopolymers. 2003 Jan;68(1):35-46. doi: 10.1002/bip.10280. Biopolymers. 2003. PMID: 12579578
-
Protein folding kinetics: timescales, pathways and energy landscapes in terms of sequence-dependent properties.Fold Des. 1997;2(1):1-22. doi: 10.1016/S1359-0278(97)00002-3. Fold Des. 1997. PMID: 9080195
-
Folding of horse cytochrome c in the reduced state.J Mol Biol. 2001 Oct 5;312(5):1135-60. doi: 10.1006/jmbi.2001.4993. J Mol Biol. 2001. PMID: 11580255
-
Protein folding intermediates and pathways studied by hydrogen exchange.Annu Rev Biophys Biomol Struct. 2000;29:213-38. doi: 10.1146/annurev.biophys.29.1.213. Annu Rev Biophys Biomol Struct. 2000. PMID: 10940248 Review.
-
From Levinthal to pathways to funnels.Nat Struct Biol. 1997 Jan;4(1):10-9. doi: 10.1038/nsb0197-10. Nat Struct Biol. 1997. PMID: 8989315 Review.
Cited by
-
Kinetic analysis of ribosome-bound fluorescent proteins reveals an early, stable, cotranslational folding intermediate.J Biol Chem. 2012 Jan 20;287(4):2568-78. doi: 10.1074/jbc.M111.318766. Epub 2011 Nov 28. J Biol Chem. 2012. PMID: 22128180 Free PMC article.
-
Role of unfolded state heterogeneity and en-route ruggedness in protein folding kinetics.Protein Sci. 2006 Mar;15(3):564-82. doi: 10.1110/ps.051758206. Protein Sci. 2006. PMID: 16501227 Free PMC article.
-
An adaptive weighted ensemble procedure for efficient computation of free energies and first passage rates.J Chem Phys. 2012 Sep 14;137(10):104101. doi: 10.1063/1.4748278. J Chem Phys. 2012. PMID: 22979844 Free PMC article.
-
Protein folding pathways from replica exchange simulations and a kinetic network model.Proc Natl Acad Sci U S A. 2005 May 10;102(19):6801-6. doi: 10.1073/pnas.0408970102. Epub 2005 Mar 30. Proc Natl Acad Sci U S A. 2005. PMID: 15800044 Free PMC article.
-
Markov dynamic models for long-timescale protein motion.Bioinformatics. 2010 Jun 15;26(12):i269-77. doi: 10.1093/bioinformatics/btq177. Bioinformatics. 2010. PMID: 20529916 Free PMC article.
References
-
- Bahar, I. 1989. Stochastics of rotational isomeric transitions in polymer chains. J. Chem. Phys. 91 6525–6531.
-
- Bryngelson, J.D., Onuchic, J.N., Socci, N.D., and Wolynes, P.G. 1995. Funnels, pathways, and the energy landscape of protein folding: A synthesis. Proteins 21 167–195. - PubMed
Publication types
MeSH terms
Substances
LinkOut - more resources
Full Text Sources
