. 2002 Aug 1;21(15):4136-44.
doi: 10.1093/emboj/cdf392.

Localization of the yeast RNA polymerase I-specific subunits

Affiliations

Localization of the yeast RNA polymerase I-specific subunits

Nicolas Bischler et al. EMBO J. .

Abstract

The spatial distribution of four subunits specifically associated to the yeast DNA-dependent RNA polymerase I (RNA pol I) was studied by electron microscopy. A structural model of the native enzyme was determined by cryo-electron microscopy from isolated molecules and was compared with the atomic structure of RNA pol II Delta 4/7, which lacks the specific polypeptides. The two models were aligned and a difference map revealed four additional protein densities present in RNA pol I, which were characterized by immunolabelling. A protruding protein density named stalk was found to contain the RNA pol I-specific subunits A43 and A14. The docking with the atomic structure showed that the stalk protruded from the structure at the same site as the C-terminal domain (CTD) of the largest subunit of RNA pol II. Subunit A49 was placed on top of the clamp whereas subunit A34.5 bound at the entrance of the DNA binding cleft, where it could contact the downstream DNA. The location of the RNA pol I-specific subunits is correlated with their biological activity.


Figures
None
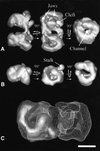
Fig. 1. A 3D model of a negatively stained RNA pol I dimer and monomer. (A) Surface representation of the yeast RNA pol I dimers at 3.4 nm resolution. The 2-fold symmetry axis of the dimer is horizontal in the left panel, perpendicular to the plane in the middle panel and vertical in the right panel. Characteristic structural features described in the text, such as the cleft, the channel and the jaws, are indicated. (B) 3D model of the RNA pol I monomer represented in the same orientations as the lower molecule in the dimer shown in (A). The stalk substructure protruding from the model is indicated. (C) Docking of the monomer into the envelope of the dimer, showing that the interface is constituted mainly of the stalk interacting with the end of the cleft. The position of the stalk may be slightly different in the monomer than in the dimer. Bar represents 10 nm in (A) and (B), and 5.5 nm in (C).
None
Fig. 2. 3D model of frozen hydrated yeast RNA pol I. (A) Diagram showing the orientations of the 266 class averages used in the final reconstruction. Each class average is represented by a point in a (β,γ) coordinate system. (B) Diagram representing the Fourier shell correlation function between two independent reconstructions (continuous line) and the 3σ threshold curve (dotted line). The value of the Fourier shell correlation coefficient is indicated compared with the resolution in 1/Å. (C) Surface representation of the 3D reconstruction of the yeast RNA pol I at a resolution of 3.2 nm. Bar = 5 nm.
None
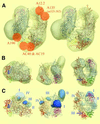
Fig. 3. Comparison of the cryo-electron microscopic model of RNA pol I with the atomic model of RNA pol II Δ4/7. (A) Stereoviews of the atomic model of RNA pol II Δ4/7 (ribbon diagram) docked into the cryo-electron microscopy envelope of RNA pol I (transparent shell). The 10 common or homologous subunits are colour coded as follows: Rpb1, white; Rpb2, gold; Rpb3, red; Rpb5, pink; Rpb6, light blue; Rpb8, dark green; Rpb9, orange; Rpb10, dark blue; Rpb11, yellow; Rpb12, light green. The docking was confirmed by previous immunolabelling experiments, represented as orange dots on the left panel. (B) The docking is represented along the three characteristic orientations shown in Figure 1B. (C) Density difference map between RNA pol I and RNA pol II, thresholded at 3σ. Additional densities present in RNA pol I are represented in blue on the atomic model of RNA pol II Δ4/7 (ribbon diagram), and are labelled I, II, III and IV.
None
Fig. 4. Immunolabelling of the RNA pol I-specific subunits. Purified RNA pol I was incubated with subunit-specific antibodies, and molecular images of immune complexes were analysed to obtain characteristic noise-free images of the labelled enzyme. The statistically significant difference with the corresponding unlabelled view is shown in yellow and is overlaid on the labelled view, represented as blue isodensity contour levels. (A) Characteristic views of RNA pol I dimers labelled with a subunit A49-specific antibody. Left: side view; middle: top view; right: bottom view. (B) Side view (left) and top view (right) of RNA pol I monomers labelled with a subunit A34.5-specific antibody, showing that A34.5 is located at the entrance to the cleft. (C) Side view of a labelled RNA pol I monomer showing that the HA-tagged N-terminus of subunit A14 is placed at the tip of the stalk. (D) Side views of labelled RNA pol I dimers (left) and monomers (right) showing the HA-tagged N-terminus of subunit A43 in the stalk. (E) Representation of the subunit-specific antibody binding sites on the surface of the 3D model of RNA pol I, oriented as in Figure 1B.
None
Fig. 5. Mapping the domains of A190 and A135 interacting with the RNA pol I-specific subunits. Schematic alignment of the largest subunit Rpb1 with A190 (A), and of the second largest subunit Rpb2 with A135 (B). Structural domains are indicated on the RNA pol II sequences and are named as in Cramer et al. (2001). Insertions larger than five residues are mapped on top of the RNA pol I sequences if present in the RNA pol II genes, and on the bottom of the RNA pol I sequences if present in the RNA pol I genes. The size of the insertions are indicated. Conserved regions are represented by black boxes. The regions contacting the additional densities present in RNA pol I are indicated by black bars.

Similar articles

Cited by

References

    1. Buhler J.M., Huet,J., Davies,K.E., Sentenac,A. and Fromageot,P. (1980) Immunological studies of yeast nuclear RNA polymerases at the subunit level. J. Biol. Chem., 255, 9949–9954. - PubMed
    1. Chedin S., Riva,M., Schultz,P., Sentenac,A. and Carles,C. (1998) The RNA cleavage activity of RNA polymerase III is mediated by an essential TFIIS-like subunit and is important for transcription termination. Genes Dev., 12, 3857–3871. - PMC - PubMed
    1. Cramer P., Bushnell,D.A. and Kornberg,R.D. (2001) Structural basis of transcription: RNA polymerase II at 2.8 Å resolution. Science, 292, 1863–1876. - PubMed
    1. Darst S.A., Edwards,A.M., Kubalek,E.W. and Kornberg,R.D. (1991) Three-dimensional structure of yeast RNA polymerase II at 16 Å resolution. Cell, 66, 121–128. - PubMed
    1. Dumay H., Rubbi,L., Sentenac,A. and Marck,C. (1999) Interaction between yeast RNA polymerase III and transcription factor TFIIIC via ABC10α and τ131 subunits. J. Biol. Chem., 274, 33462–33468. - PubMed

Publication types

MeSH terms