

Enhanced microtubule-dependent trafficking and p53 nuclear accumulation by suppression of microtubule dynamics
- PMID: 12145320
- PMCID: PMC125062
- DOI: 10.1073/pnas.132275599
Enhanced microtubule-dependent trafficking and p53 nuclear accumulation by suppression of microtubule dynamics
Abstract
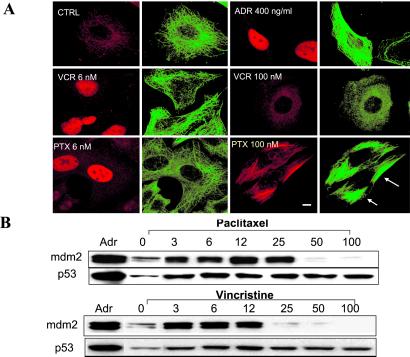
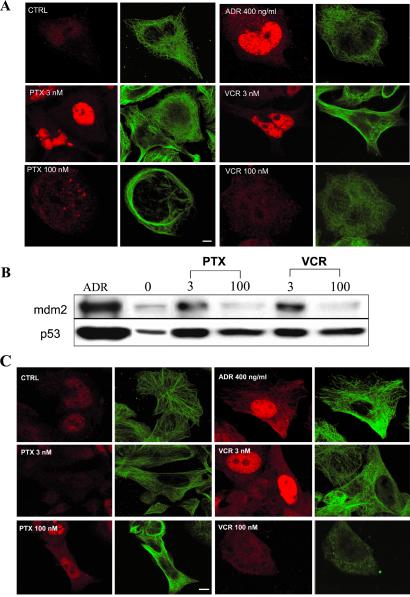
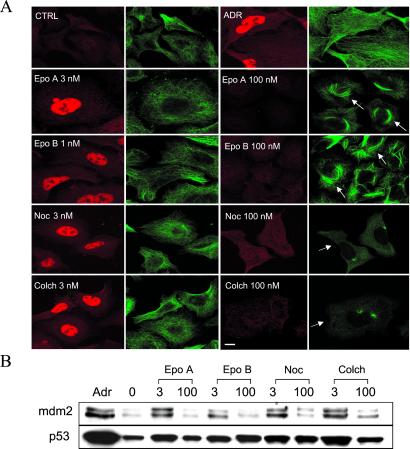
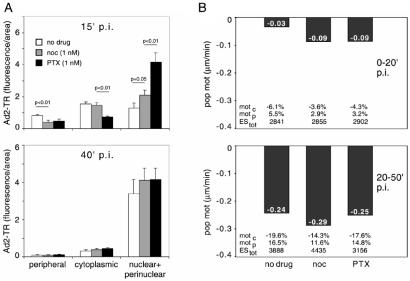
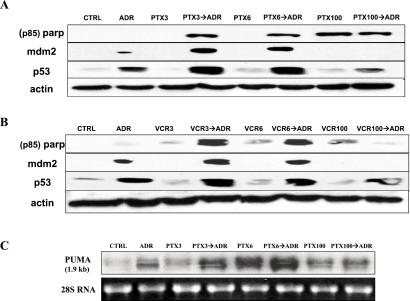
The tumor suppressor protein p53 localizes to microtubules (MT) and, in response to DNA damage, is transported to the nucleus via the MT minus-end-directed motor protein dynein. Dynein is also responsible for MT-mediated nuclear targeting of adenovirus type 2 (Ad2). Here we show that treatment with low concentrations of MT-targeting compounds (MTCs) that do not disrupt the MT network but are known to suppress MT dynamics enhanced p53 nuclear accumulation, and the activation of the p53-downstream target genes. p53 nuclear accumulation required binding of MTCs to MTs and enhanced the induction of p53-up-regulated modulator of apoptosis (PUMA) mRNA and apoptosis on challenging cells with the DNA-damaging drug adriamycin. Low concentrations of MTCs enhanced the rate of movement of fluorescent Ad2 to the nucleus and increased the nuclear targeting efficiency of Ad2. We propose that suppression of MT dynamics by low concentrations of MTCs enhances MT-dependent trafficking toward the minus ends of MTs and facilitates nuclear targeting.
Figures
Similar articles
-
p53 is associated with cellular microtubules and is transported to the nucleus by dynein.Nat Cell Biol. 2000 Oct;2(10):709-17. doi: 10.1038/35036335. Nat Cell Biol. 2000. PMID: 11025661
-
Kinetic stabilization of microtubule dynamic instability by benomyl increases the nuclear transport of p53.Biochem Pharmacol. 2008 Dec 15;76(12):1669-80. doi: 10.1016/j.bcp.2008.09.001. Epub 2008 Sep 6. Biochem Pharmacol. 2008. PMID: 18823952
-
Microtubule-dependent plus- and minus end-directed motilities are competing processes for nuclear targeting of adenovirus.J Cell Biol. 1999 Feb 22;144(4):657-72. doi: 10.1083/jcb.144.4.657. J Cell Biol. 1999. PMID: 10037788 Free PMC article.
-
Increased p53 phosphorylation after microtubule disruption is mediated in a microtubule inhibitor- and cell-specific manner.Oncogene. 2001 Jan 4;20(1):113-24. doi: 10.1038/sj.onc.1204060. Oncogene. 2001. PMID: 11244509
-
Microtubule-targeting agents and neurodegeneration.Drug Discov Today. 2021 Feb;26(2):604-615. doi: 10.1016/j.drudis.2020.11.033. Epub 2020 Dec 3. Drug Discov Today. 2021. PMID: 33279455 Review.
Cited by
-
Tubulin acetylation enhances lung cancer resistance to paclitaxel-induced cell death through Mcl-1 stabilization.Cell Death Discov. 2021 Apr 6;7(1):67. doi: 10.1038/s41420-021-00453-9. Cell Death Discov. 2021. PMID: 33824297 Free PMC article.
-
Evaluation of Eribulin Combined with Irinotecan for Treatment of Pediatric Cancer Xenografts.Clin Cancer Res. 2020 Jun 15;26(12):3012-3023. doi: 10.1158/1078-0432.CCR-19-1822. Epub 2020 Mar 17. Clin Cancer Res. 2020. PMID: 32184294 Free PMC article.
-
Rationale for combination of paclitaxel and CDK4/6 inhibitor in ovarian cancer therapy - non-mitotic mechanisms of paclitaxel.Front Oncol. 2022 Sep 15;12:907520. doi: 10.3389/fonc.2022.907520. eCollection 2022. Front Oncol. 2022. PMID: 36185294 Free PMC article. Review.
-
Microtubule-targeting agents augment the toxicity of DNA-damaging agents by disrupting intracellular trafficking of DNA repair proteins.Proc Natl Acad Sci U S A. 2015 Feb 3;112(5):1571-6. doi: 10.1073/pnas.1416418112. Epub 2015 Jan 20. Proc Natl Acad Sci U S A. 2015. PMID: 25605897 Free PMC article.
-
Tau affects P53 function and cell fate during the DNA damage response.Commun Biol. 2020 May 19;3(1):245. doi: 10.1038/s42003-020-0975-4. Commun Biol. 2020. PMID: 32427887 Free PMC article.
References
-
- Gundersen G. G. & Cook, T. A. (1999) Curr. Opin. Cell Biol. 11, 81-94. - PubMed
-
- Nogales E. (2000) Annu. Rev. Biochem. 69, 277-302. - PubMed
-
- Jordan M. A. & Wilson, L. (1998) Curr. Opin. Cell Biol. 10, 123-130. - PubMed
-
- Fojo T. & Giannakakou, P. (2000) Curr. Opin. Oncol. Endocrinol. Metab. Invest. Drugs 2, 293-304.
Publication types
MeSH terms
Substances
LinkOut - more resources
Full Text Sources
Other Literature Sources
Molecular Biology Databases
Research Materials
Miscellaneous
