

Assigning numbers to the arrows: parameterizing a gene regulation network by using accurate expression kinetics
- PMID: 12145321
- PMCID: PMC124972
- DOI: 10.1073/pnas.152046799
Assigning numbers to the arrows: parameterizing a gene regulation network by using accurate expression kinetics
Abstract
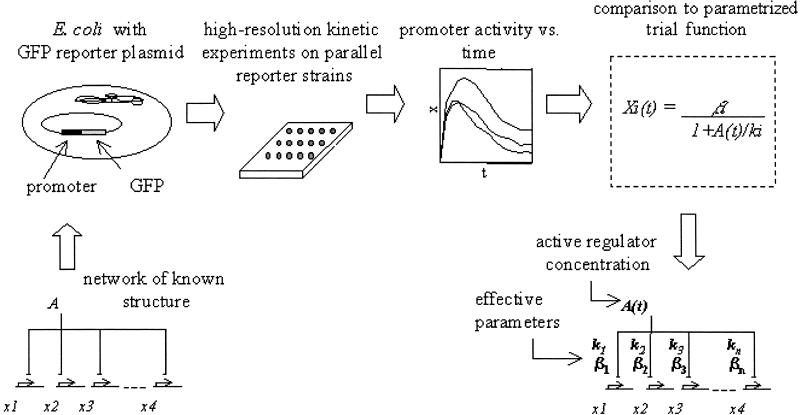
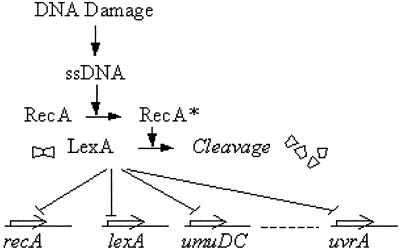
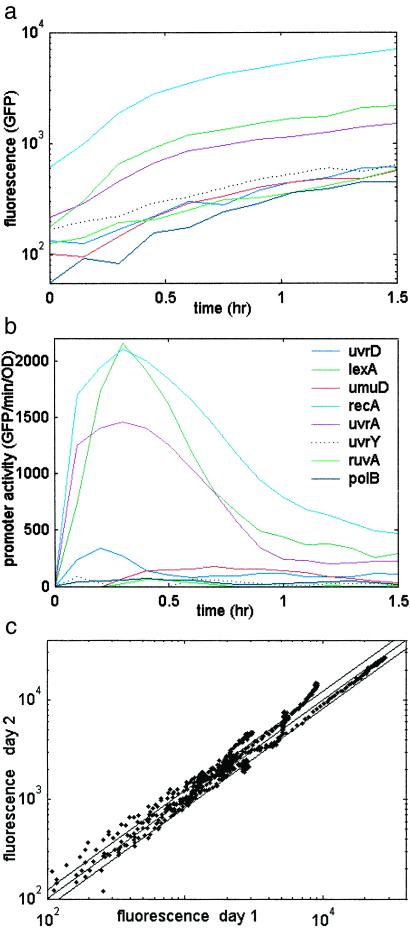
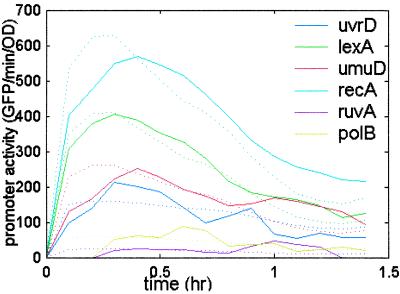
A basic challenge in systems biology is to understand the dynamical behavior of gene regulation networks. Current approaches aim at determining the network structure based on genomic-scale data. However, the network connectivity alone is not sufficient to define its dynamics; one needs to also specify the kinetic parameters for the regulation reactions. Here, we ask whether effective kinetic parameters can be assigned to a transcriptional network based on expression data. We present a combined experimental and theoretical approach based on accurate high temporal-resolution measurement of promoter activities from living cells by using green fluorescent protein (GFP) reporter plasmids. We present algorithms that use these data to assign effective kinetic parameters within a mathematical model of the network. To demonstrate this, we employ a well defined network, the SOS DNA repair system of Escherichia coli. We find a strikingly detailed temporal program of expression that correlates with the functional role of the SOS genes and is driven by a hierarchy of effective kinetic parameter strengths for the various promoters. The calculated parameters can be used to determine the kinetics of all SOS genes given the expression profile of just one representative, allowing a significant reduction in complexity. The concentration profile of the master SOS transcriptional repressor can be calculated, demonstrating that relative protein levels may be determined from purely transcriptional data. This finding opens the possibility of assigning kinetic parameters to transcriptional networks on a genomic scale.
Figures
Similar articles
-
Non-equilibrium repressor binding kinetics link DNA damage dose to transcriptional timing within the SOS gene network.PLoS Genet. 2018 Jun 1;14(6):e1007405. doi: 10.1371/journal.pgen.1007405. eCollection 2018 Jun. PLoS Genet. 2018. PMID: 29856734 Free PMC article.
-
The Parameter-Fitness Landscape of lexA Autoregulation in Escherichia coli.mSphere. 2020 Aug 19;5(4):e00718-20. doi: 10.1128/mSphere.00718-20. mSphere. 2020. PMID: 32817380 Free PMC article.
-
The SOS promoter dinH is essential for ftsK transcription during cell division.Microbiology (Reading). 2000 Nov;146 ( Pt 11):2891-2899. doi: 10.1099/00221287-146-11-2891. Microbiology (Reading). 2000. PMID: 11065367
-
SOS response as an adaptive response to DNA damage in prokaryotes.EXS. 1996;77:221-35. doi: 10.1007/978-3-0348-9088-5_14. EXS. 1996. PMID: 8856977 Review.
-
Mutagenesis and more: umuDC and the Escherichia coli SOS response.Genetics. 1998 Apr;148(4):1599-610. doi: 10.1093/genetics/148.4.1599. Genetics. 1998. PMID: 9560379 Free PMC article. Review.
Cited by
-
Synthetic biology: new engineering rules for an emerging discipline.Mol Syst Biol. 2006;2:2006.0028. doi: 10.1038/msb4100073. Epub 2006 May 16. Mol Syst Biol. 2006. PMID: 16738572 Free PMC article.
-
Reconstructing repressor protein levels from expression of gene targets in Escherichia coli.Proc Natl Acad Sci U S A. 2006 Dec 5;103(49):18592-6. doi: 10.1073/pnas.0603390103. Epub 2006 Nov 22. Proc Natl Acad Sci U S A. 2006. PMID: 17121995 Free PMC article.
-
A nonlinear discrete dynamical model for transcriptional regulation: construction and properties.Biophys J. 2004 Apr;86(4):1922-45. doi: 10.1016/S0006-3495(04)74257-5. Biophys J. 2004. PMID: 15041638 Free PMC article.
-
Genome-wide analysis of the context-dependence of regulatory networks.Genome Biol. 2005;6(2):206. doi: 10.1186/gb-2005-6-2-206. Epub 2005 Jan 27. Genome Biol. 2005. PMID: 15693953 Free PMC article. Review.
-
HSCVFNT: Inference of Time-Delayed Gene Regulatory Network Based on Complex-Valued Flexible Neural Tree Model.Int J Mol Sci. 2018 Oct 15;19(10):3178. doi: 10.3390/ijms19103178. Int J Mol Sci. 2018. PMID: 30326663 Free PMC article.
References
-
- Hartwell L., Hopfield, J., Leibler, S. & Murray, A. (1999) Nature (London) 402,Suppl., C47-C52. - PubMed
-
- Ideker T., Thorsson, V., Ranish, J., Christmas, R., Buhler, J., Eng, J., Bumgarner, R., Goodlett, D., Aebersold, R. & Hood, L. (2001) Science 292, 929-934. - PubMed
-
- Tavazoie S., Hughes, J., Campbell, M., Cho, R. & Church, G. (1999) Nat. Genet. 22, 281-285. - PubMed
-
- Lockhart D. & Winzeler, E. (2000) Nature (London) 405, 827-836. - PubMed
-
- Simon I., Barnett, J., Hannett, N., Harbison, C., Rinaldi, N., Volkert, T., Wyrick, J., Zeitlinger, J., Gifford, D., Jaakkola, T. & Young, R. (2001) Cell 106, 697-708. - PubMed
Publication types
MeSH terms
Substances
LinkOut - more resources
Full Text Sources
Other Literature Sources
