

Review
doi: 10.1128/AEM.68.8.3673-3682.2002.
Phylogenetic approaches for describing and comparing the diversity of microbial communities
Affiliations
- PMID: 12147459
- PMCID: PMC124012
- DOI: 10.1128/AEM.68.8.3673-3682.2002
Item in Clipboard
Review
Phylogenetic approaches for describing and comparing the diversity of microbial communities
Appl Environ Microbiol.
2002 Aug.
No abstract available
Figures
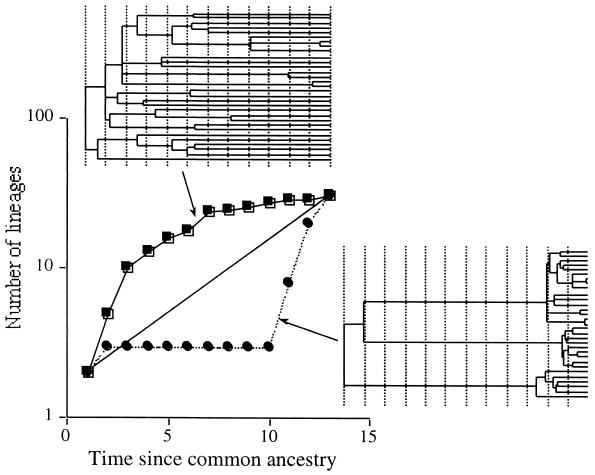
Lineage-per-time plots constructed by counting the numbers of lineages present at different time intervals for trees in which branch lengths were optimized by using maximum likelihood, assuming a molecular clock. Time intervals are equal lengths and were defined arbitrarily. The upper tree is one in which there is an excess of highly divergent lineages, yielding a concave lineage-per-time plot. The tree on the lower right is one in which there is an excess of closely related lineages, yielding a convex lineage-per-time plot. Constant rates of birth and extinction of lineages yield exponential lineage-per-time plots, whose signature is indicated by the solid straight line.
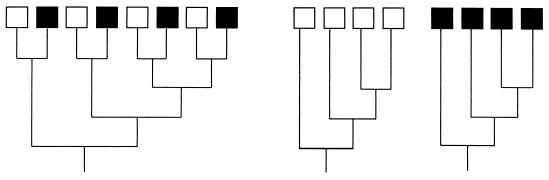
Comparison of the genetic diversities of two communities, one indicated by open boxes and the other indicated by solid boxes. The trees are drawn such that branch lengths are proportional to the amounts of differentiation. The tree on the left shows the two communities combined; none of the species overlap, but each community harbors identical phylogenetic diversity, as shown by the two trees on the right.
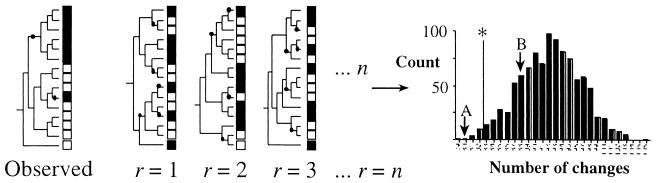
Illustration of the P test. The community type (solid or open boxes) is shown for a sample of 15 sequences. Given the observed phylogenetic relationships of the 15 sequences, the distribution of sequences with respect to community type requires two changes to explain how community type and phylogeny covary (changes are indicated by solid circles). The significance of covariation can be assessed by constructing n random trees and, for each replicate tree (r), determining the number of changes required to explain the covariation of community type and phylogeny. Values for random trees can be summarized as a frequency distribution, and the significance of the observed covariation can be established by comparison. The vertical line labeled with an asterisk delimits significance. In this case, hypothetical case A is significant (indicating that two communities harbor distinct groups of microbes), whereas hypothetical case B is not significant.
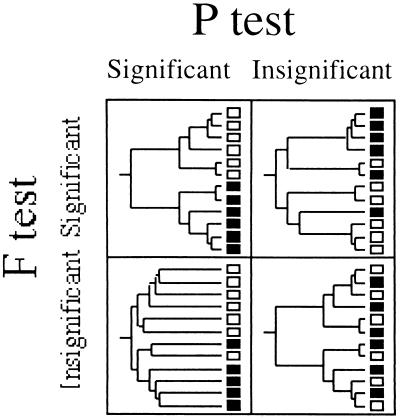
Examples of phylogenetic trees depicting patterns of relationships that would result in the four possible results from the two tests of differentiation discussed in this paper. The open and solid squares represent different communities, and the trees are drawn with branch lengths proportional to the amounts of sequence evolution. Clear differentiation is evident if both FST and P tests are significant. By contrast, insignificance for both tests implies that the samples from two communities are drawn from the same pool of sequences. A significant FST test coupled with an insignificant P test implies that the tree contains several clades of closely related bacteria that are unique to one community or the other but that these clades are interspersed throughout the phylogenetic tree of all samples. Finally, a significant P test coupled with an insignificant FST test might reflect the existence of highly divergent lineages within each community (such that the within-community diversity approaches the total diversity) but indicate that there is significant covariation between community and phylogeny.

Lineage-per-time plot for the improved (•) and unimproved (□) grassland microbial communities. The ordinate is the log of the number of lineages, and the abscissa is the time (in arbitrary units) measured from the common ancestor. See the legend to Fig. 1 for a description of how the plot was constructed. The phylogenetic diversities of the two communities are virtually identical.
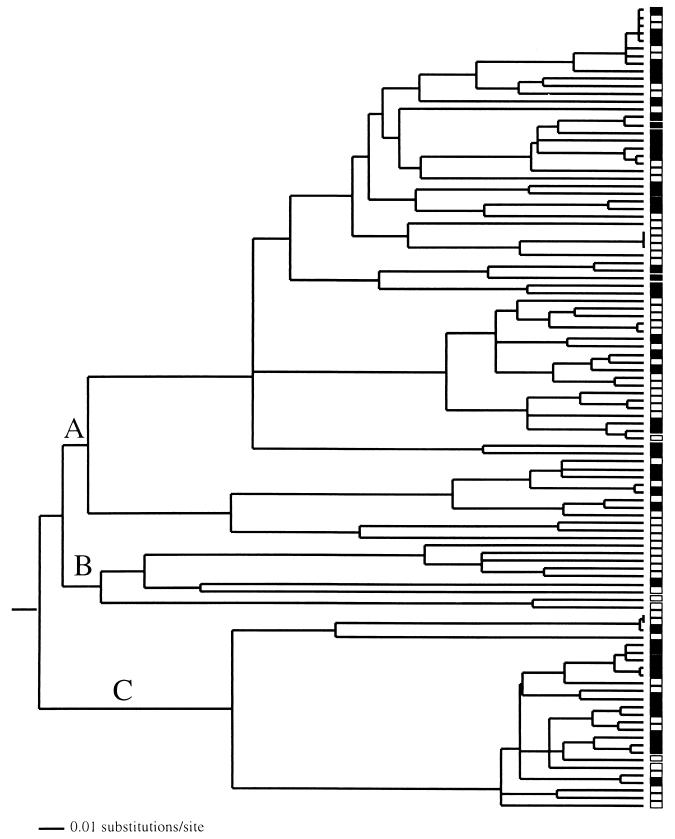
16S rDNA gene tree for the α-proteobacteria sampled from improved (solid boxes) and unimproved (open boxes) grasslands. The letters indicate specific clades that were subject to tests of differentiation (Table 3). The tree was produced by neighbor-joining clustering of genetic distances corrected for multiple substitutions by using a HKY + G + I model of evolution with PAUP* (25). (For details about the construction of phylogenetic trees from sequence data, see reference .) Optimization of the branch lengths was done by using the maximum-likelihood method (using the HKY + G + I model) subject to the constraint that all sampled sequences were contemporary (i.e., molecular clock was enforced).
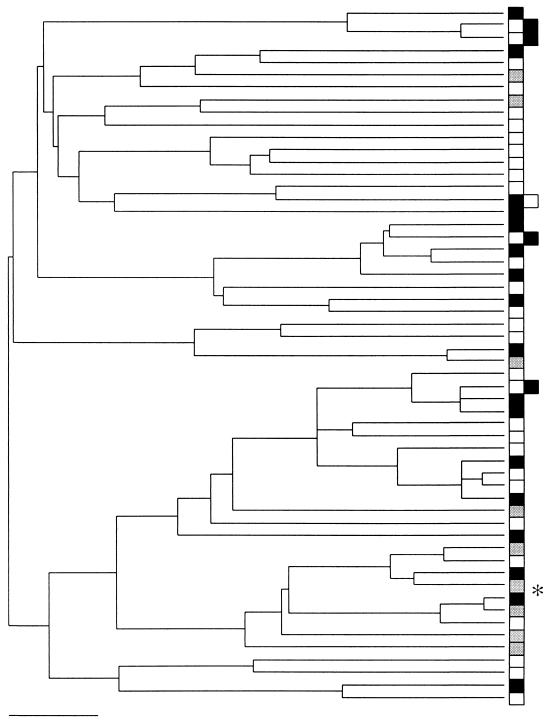
16S rDNA gene tree for Cariaco Basin samples. The boxes identify eubacteria sampled from different environments, as follows: open boxes, 1,310 m; solid boxes, 500 m; shaded boxes, 320 m. The tree was generated by using the methods described in the legend to Fig. 6. None of the groups exhibited a restricted distribution. The asterisk indicates the one sequence (phylotype) that accounted for significant differentiation between the shallow-water sample (320 m) and the two deeper-water samples based on the FST test when all sequences were analyzed. Scale bar = 0.05 substitution per site.
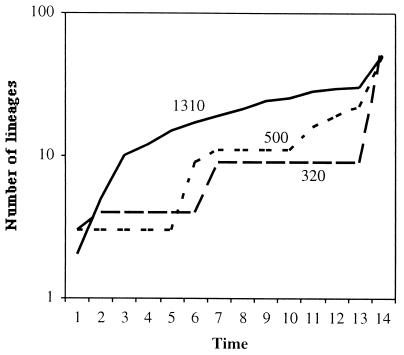
Lineage-per-time plots for the three environments sampled from Cariaco Basin. A comparison across communities suggests that an excess of highly divergent microbial lineages exists at 1,310 m compared to the lineages at the shallower sites.
References
-
- Boetius, A., K. Ravenschlag, C. J. Schubert, D. Rickert, F. Widdel, A. Gieseke, R. Amann, B. B. Jorgensen, U. Witte, and O. Pfannkuche. 2000. A marine microbial consortium apparently mediating anaerobic oxidation of methane. Nature 407:623-626. - PubMed
-
- Edwards, S. V. 1993. Mitochondrial gene genealogy and gene flow among island and mainland populations of the sedentary songbird, the grey-crowned babbler (Pomatostomus temporalis). Evolution 47:1118-1137. - PubMed
-
- Faith, D. 1994. Phylogenetic pattern and the quantification of organismal biodiversity. Phil. Trans. R. Soc. Lond. B Biol. Sci. 345:45-58. - PubMed
Publication types
MeSH terms
Substances
LinkOut - more resources
Full Text Sources
Other Literature Sources
