

Comparison of in vitro cell culture and a mouse assay for measuring infectivity of Cryptosporidium parvum
- PMID: 12147476
- PMCID: PMC124000
- DOI: 10.1128/AEM.68.8.3809-3817.2002
Comparison of in vitro cell culture and a mouse assay for measuring infectivity of Cryptosporidium parvum
Abstract
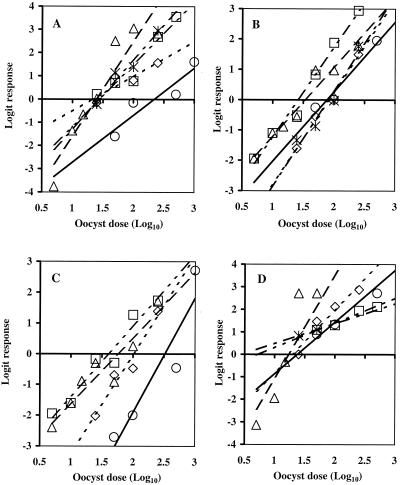
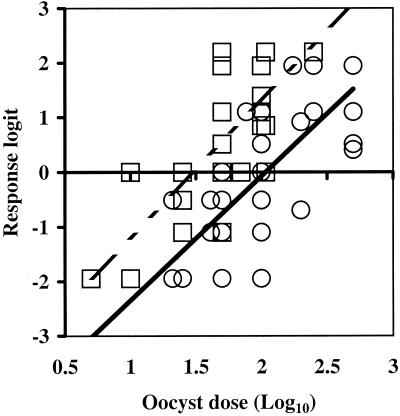
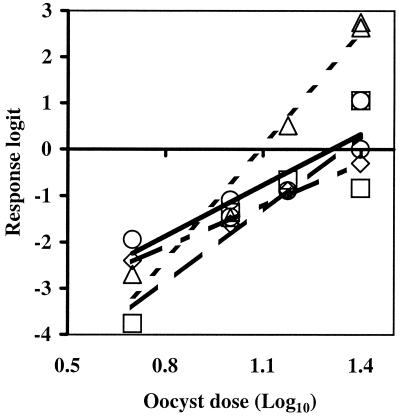
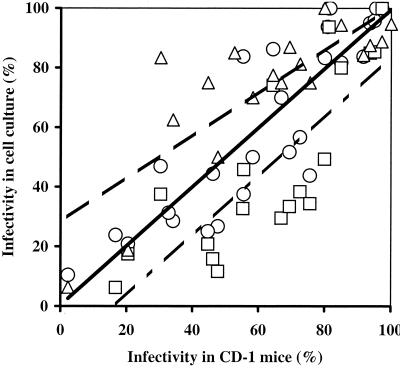
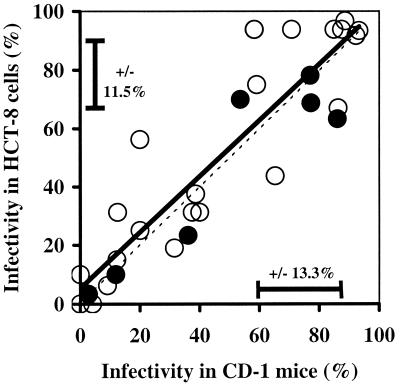
In vitro cell cultures were compared to neonatal mice for measuring the infectivity of five genotype 2 isolates of Cryptosporidium parvum. Oocyst doses were enumerated by flow cytometry and delivered to animals and cell monolayers by using standardized procedures. Each dose of oocysts was inoculated into up to nine replicates of 9 to 12 mice or 6 to 10 cell culture wells. Infections were detected by hematoxylin and eosin staining in CD-1 mice, by reverse transcriptase PCR in HCT-8 and Caco-2 cells, and by immunofluorescence microscopy in Madin-Darby canine kidney (MDCK) cells. Infectivity was expressed as a logistic transformation of the proportion of animals or cell culture wells that developed infection at each dose. In most instances, the slopes of the dose-response curves were not significantly different when we compared the infectivity models for each isolate. The 50% infective doses for the different isolates varied depending on the method of calculation but were in the range from 16 to 347 oocysts for CD-1 mice and in the ranges from 27 to 106, 31 to 629, and 13 to 18 oocysts for HCT-8, Caco-2, and MDCK cells, respectively. The average standard deviations for the percentages of infectivity for all replicates of all isolates were 13.9, 11.5, 13.2, and 10.7% for CD-1 mice, HCT-8 cells, Caco-2 cells, and MDCK cells, respectively, demonstrating that the levels of variability were similar in all assays. There was a good correlation between the average infectivity for HCT-8 cells and the results for CD-1 mice across all isolates for untreated oocysts (r = 0.85, n = 25) and for oocysts exposed to ozone and UV light (r = 0.89, n = 29). This study demonstrated that in vitro cell culture was equivalent to the "gold standard," mouse infectivity, for measuring the infectivity of C. parvum and should therefore be considered a practical and accurate alternative for assessing oocyst infectivity and inactivation. However, the high levels of variability displayed by all assays indicated that infectivity and disinfection experiments should be limited to discerning relatively large differences.
Figures
References
-
- Arrowood, M. J., and K. Donaldson. 1996. Improved purification methods for calf-derived Cryptosporidium parvum oocysts using discontinuous sucrose and cesium gradients. J. Eukaryot. Microbiol. 43:89. - PubMed
-
- Arrowood, M. J. 1988. Ph.D. thesis. University of Arizona, Tucson.
-
- Clancy, J. L., Z. Bukhari, R. M. McCuin, T. P. Clancy, M. M. Marshall, D. G. Korich, C. R. Fricker, N. Sykes, H. V. Smith, J. O'Grady, J. P. Rosen, J. Sobrinho, and F. W. Schaefer III. 2000. Cryptosporidium viability and infectivity methods. American Water Works Association Research Foundation, Denver, Colo.
-
- Clesceri, L. S., A. E. Greenberg, and A. D. Eaton. 1998. Method 4500-O3, p. 4-137-4-139. In Standard methods for the examination of water and wastewater. American Public Health Association, Washington, D.C.
Publication types
MeSH terms
Substances
LinkOut - more resources
Full Text Sources
Medical
