. 2002 Aug;68(8):3996-4006.
doi: 10.1128/AEM.68.8.3996-4006.2002.

Mechanisms and rates of bacterial colonization of sinking aggregates

Affiliations

Mechanisms and rates of bacterial colonization of sinking aggregates

Thomas Kiørboe et al. Appl Environ Microbiol. 2002 Aug.

Abstract

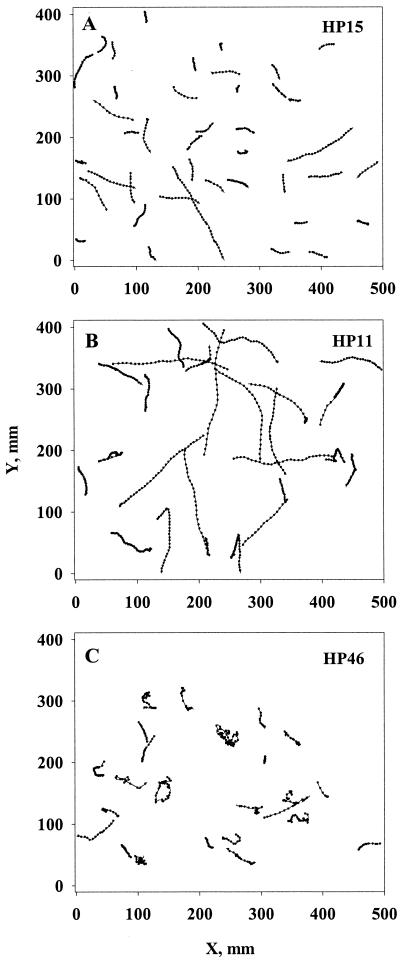
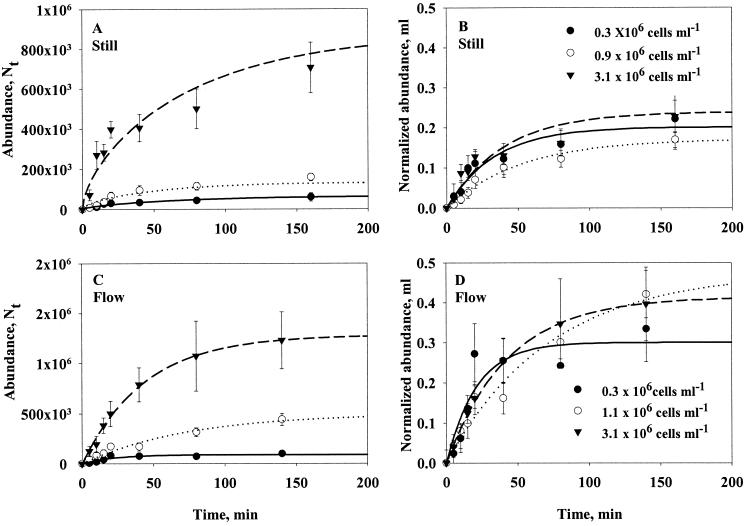
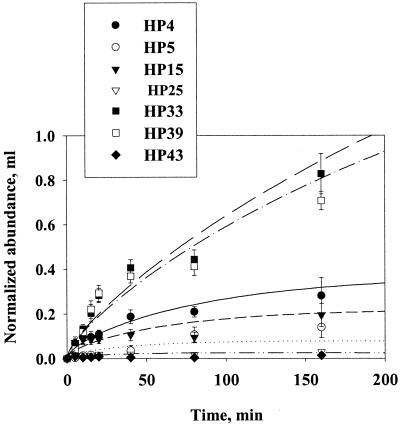
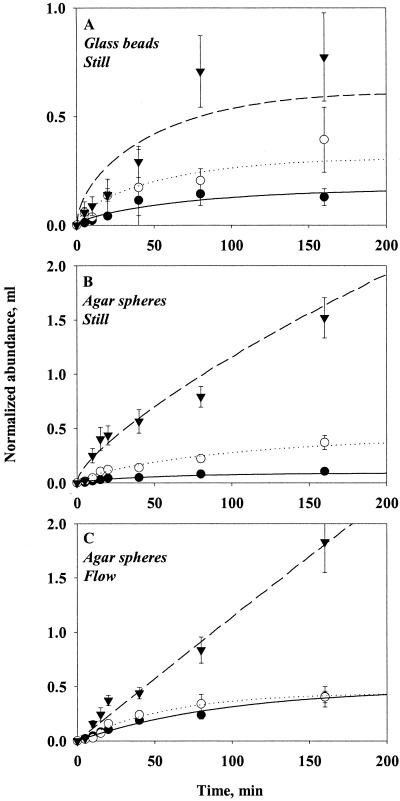
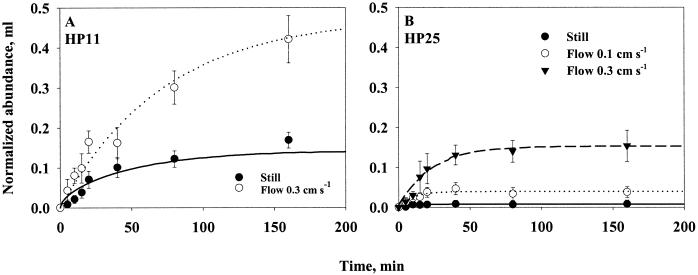
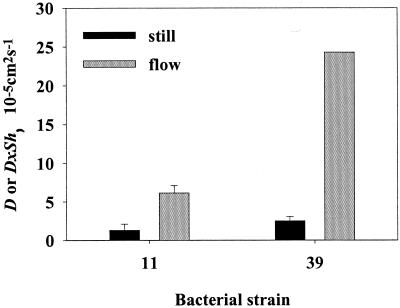
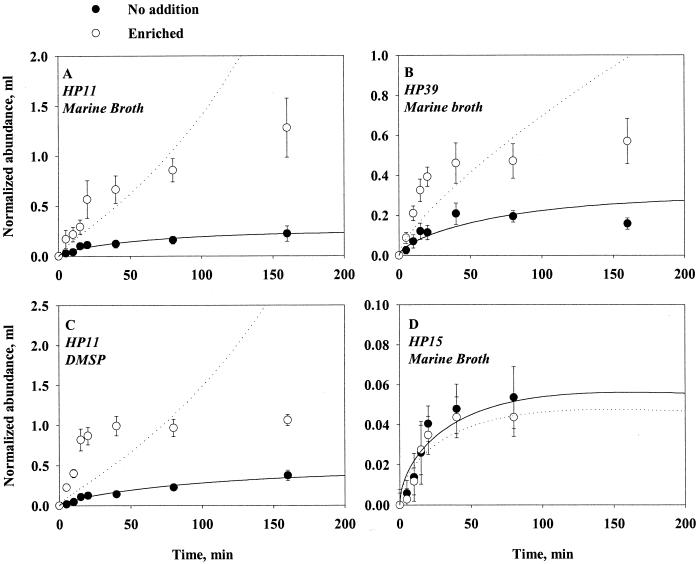
Quantifying the rate at which bacteria colonize aggregates is a key to understanding microbial turnover of aggregates. We used encounter models based on random walk and advection-diffusion considerations to predict colonization rates from the bacteria's motility patterns (swimming speed, tumbling frequency, and turn angles) and the hydrodynamic environment (stationary versus sinking aggregates). We then experimentally tested the models with 10 strains of bacteria isolated from marine particles: two strains were nonmotile; the rest were swimming at 20 to 60 microm s(-1) with different tumbling frequency (0 to 2 s(-1)). The rates at which these bacteria colonized artificial aggregates (stationary and sinking) largely agreed with model predictions. We report several findings. (i) Motile bacteria rapidly colonize aggregates, whereas nonmotile bacteria do not. (ii) Flow enhances colonization rates. (iii) Tumbling strains colonize aggregates enriched with organic substrates faster than unenriched aggregates, while a nontumbling strain did not. (iv) Once on the aggregates, the bacteria may detach and typical residence time is about 3 h. Thus, there is a rapid exchange between attached and free bacteria. (v) With the motility patterns observed, freely swimming bacteria will encounter an aggregate in <1 day at typical upper-ocean aggregate concentrations. This is faster than even starving bacteria burn up their reserves, and bacteria may therefore rely solely on aggregates for food. (vi) The net result of colonization and detachment leads to a predicted equilibrium abundance of attached bacteria as a function of aggregate size, which is markedly different from field observations. This discrepancy suggests that inter- and intraspecific interactions among bacteria and between bacteria and their predators may be more important than colonization in governing the population dynamics of bacteria on natural aggregates.


Figures

FIG. 1.
FIG. 1.
2-D projections of swimming tracks of three different bacterial strains representative of the three motility types described in the text: nontumblers (strain HP15), rare tumblers (strain HP11), and frequent tumblers (strain HP46). The dots represent positions at 0.16-s (A and B) or 0.08-s (C) time intervals.
FIG. 2.
FIG. 2.
Colonization of 0.2-cm radius agar spheres in still (A) and flowing (B) water by strain HP11 bacteria. Observations (solid symbols) are described by three different models: non-steady-state diffusion (equation 8b [solid line]), steady state with detachment (equation 6a [dotted line]), and non-steady-state diffusion with detachment (equation 8a [dashed line]). Error bars indicate the standard deviations of 10 measurements.
FIG. 3.
FIG. 3.
Colonization and detachment of bacteria (strain HP11) on 0.2-cm-radius agar spheres in still water. During the first 60 min, spheres were incubated at a bacterial concentration of 2.7 × 10⁵ ml−1. At 60 min the spheres were transferred to sterile filtered seawater. Equation 8a was fitted to the data taken between 0 and 60 min, and an exponential model was fitted to the data taken from 60 min onward. Error bars indicate the standard deviations of 10 measurements.
FIG. 4.
FIG. 4.
Effect of ambient bacterial concentration on accumulation rate on 0.2-cm agar spheres of strain HP11 bacteria in still (A and B) and flowing water (0.33 cm s−1) (C and D). Panels A and C show absolute abundances of bacteria per aggregate, while panels B and D show abundances normalized with ambient concentration. Equation 8a has been fitted to the data (lines). Error bars indicate the standard deviations of 10 measurements.
FIG. 5.
FIG. 5.
Accumulation of different strains of bacteria on 0.2-cm agar spheres in still water. Equation 8a has been fitted to the data (lines). Error bars indicate the standard deviations of 10 measurements.
FIG. 6.
FIG. 6.
Average (± the standard error) diffusivities and detachment rates estimated from colonization rates of eight motile bacterial strains on 0.2-cm agar unenriched spheres in still water by fitting equation 8a to the observed accumulation of bacteria. The numbers within the columns indicate the numbers of experiments.
FIG. 7.
FIG. 7.
Effect of sphere size on the accumulation of strain HP11 bacteria in still and flowing water. Glass beads in still water (A), agar spheres in still water (B), and agar spheres in flowing water (0.27 cm s−1) (C). Equation 8a (still water) or equation 6a (flowing water) has been fitted to the data (lines). Error bars indicate the standard deviations of 10 measurements. Symbols: •, small; ○, medium; ▾, large.
FIG. 8.
FIG. 8.
Effect of water flow (0.1 or 0.3 cm s−1) on accumulation of strain HP11 (A) and strain HP25 (B) bacteria on 0.2-cm unenriched agar spheres. Equation 8a (still water) or equation 6a (flowing water) has been fitted to the data (lines). Error bars indicate the standard deviations of 10 measurements.
FIG. 9.
FIG. 9.
Average (± the standard error) estimates of diffusivity (D) or diffusivity multiplied by the Sherwood number (D · Sh) for strain HP11 and strain HP39 bacteria estimated from accumulation rates on 0.2-cm unenriched agar spheres by fitting equation 8a (still water) or equation 6a (flow) to the observed accumulation of bacteria.
FIG. 10.
FIG. 10.
Accumulation of strains HP11, HP39, and HP15 bacteria on enriched (open symbols, dotted lines) and unenriched (closed symbols, solid lines) 0.2-cm agar spheres in still water. Equation 8a has been fitted to the data (lines). In panels A, B, and D the agar spheres were enriched with 15 g of marine broth liter−1; in panel C the agar spheres were enriched with 1 mM DMSP. Error bars indicate the standard deviations of 10 measurements.
FIG. 11.
FIG. 11.
Steady-state abundances of bacteria on aggregates as a function of aggregate size predicted from equation 13 (dashed line) compared to actually observed abundances on field-collected aggregates (symbols and solid line) (taken from the compilation of Kiørboe [22]). The different symbols refer to data from different studies. The predicted relation assumes a bacterial diffusivity of 10−5 cm2 s−1. Abundances have been normalized by ambient concentrations of bacteria. The predicted abundance increases with aggregate size raised to a power of 1.45 within the aggregate size range considered, while the log-log regression for the field-collected aggregates has a slope of 0.25.

References

    1. Alldredge, A. L., and Y. Cohen. 1987. Can microscale chemical patches persist in the sea? Microelectrode study of marine snow and fecal pellets. Science 235:689-691. - PubMed
    1. Alldredge, A. L., J. J. Cole, and D. A. Caron. 1986. Production of heterotrophic bacteria inhabiting macroscopic aggregates (marine snow) from surface waters. Limnol. Oceanogr. 31:68-78.
    1. Alldredge, A. L., and C. Gotschalk. 1988. In situ settling behavior of marine snow. Limnol. Oceanogr. 33:339-351.
    1. Alldredge, A. L., and C. Gotschalk. 1990. The relative contribution of marine snow of different origin to biological processes in coastal waters. Cont. Shelf Res. 10:41-58.
    1. Alldredge, A. L., and M. Silver. 1988. Characteristics, dynamics, and significance of marine snow. Prog. Oceanogr. 20:41-58.

Publication types

LinkOut - more resources