

Exploration of inorganic C and N assimilation by soil microbes with time-of-flight secondary ion mass spectrometry
- PMID: 12147508
- PMCID: PMC124058
- DOI: 10.1128/AEM.68.8.4067-4073.2002
Exploration of inorganic C and N assimilation by soil microbes with time-of-flight secondary ion mass spectrometry
Abstract
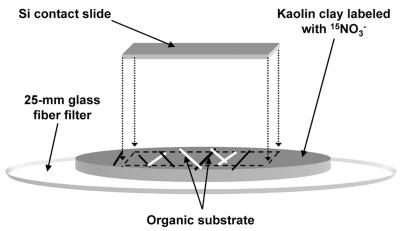
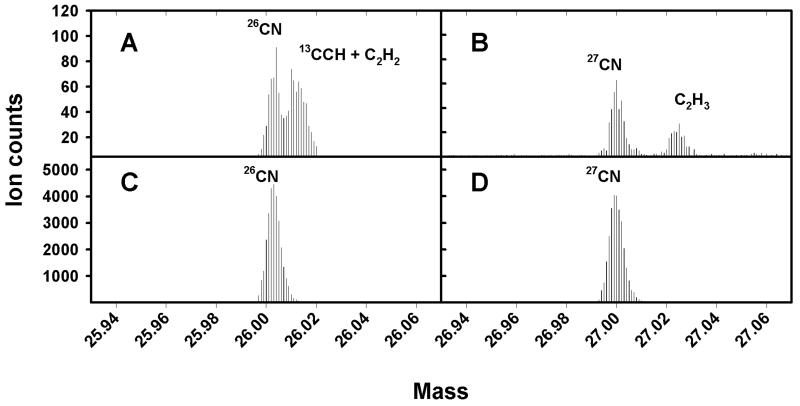
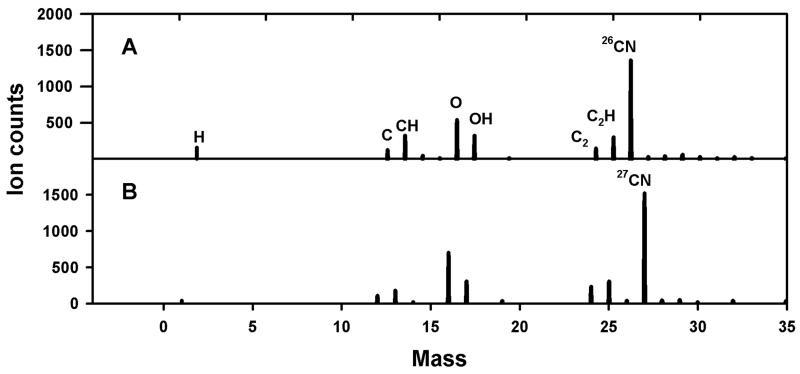
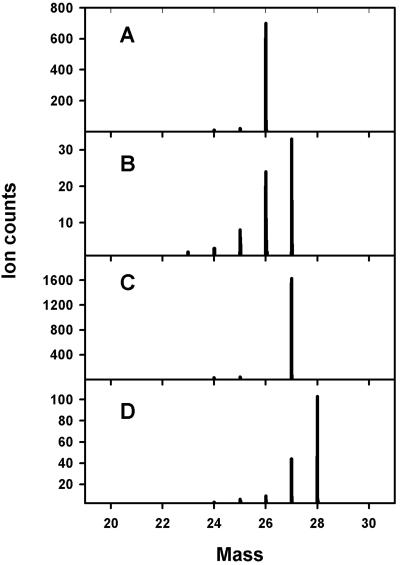
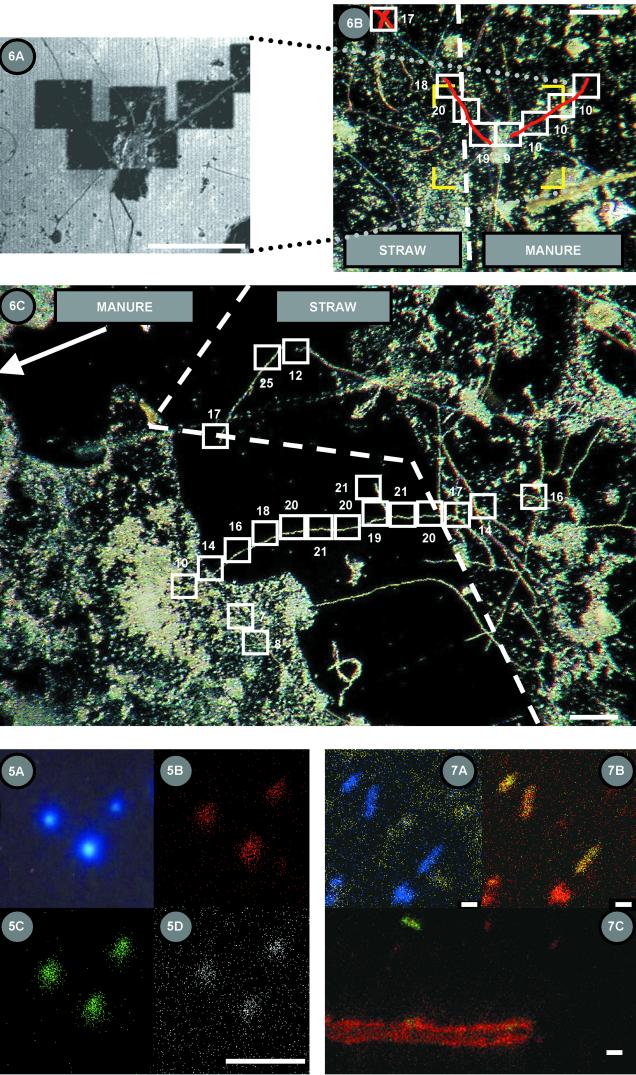
Stable C and N isotopes have long been used to examine properties of various C and N cycling processes in soils. Unfortunately, relatively large sample sizes are needed for accurate gas phase isotope ratio mass spectrometric analysis. This limitation has prevented researchers from addressing C and N cycling issues on microbially meaningful scales. Here we explored the use of time-of-flight secondary ion mass spectrometry (TOF-SIMS) to detect 13C and 15N assimilation by individual bacterial cells and to quantify N isotope ratios in bacterial samples and individual fungal hyphae. This was accomplished by measuring the relative abundances of mass 26 (12C14N-) and mass 27 (13C14N- and 12C15N-) ions sputtered with a Ga+ probe from cells adhered to an Si contact slide. TOF-SIMS was successfully used to locate and quantify the relative 15N contents of individual hyphae that grew onto Si contact slides in intimate contact with a model organomineral porous matrix composed of kaolin, straw fragments, and freshly deposited manure that was supplemented with 15NO3-. We observed that the 15N content of fungal hyphae grown on the slides was significantly lower in regions where the hyphae were influenced by N-rich manure than in regions influenced by N-deficient straw. This effect occurred over distances of tens to hundreds of microns. Our data illustrate that TOF-SIMS has the potential to locate N-assimilating microorganisms in soil and to quantify the 15N content of cells that have assimilated 15N-labeled mineral N and shows promise as a tool with which to explore the factors controlling microsite heterogeneities in soil.
Figures
Similar articles
-
Dynamic secondary ion mass spectrometry imaging of microbial populations utilizing C-labelled substrates in pure culture and in soil.Environ Microbiol. 2009 Jan;11(1):220-9. doi: 10.1111/j.1462-2920.2008.01757.x. Epub 2008 Sep 22. Environ Microbiol. 2009. PMID: 18811644 Free PMC article.
-
Nitrogen mineralization and assimilation at millimeter scales.Methods Enzymol. 2011;496:91-114. doi: 10.1016/B978-0-12-386489-5.00004-X. Methods Enzymol. 2011. PMID: 21514461 Review.
-
The differential assimilation of nitrogen fertilizer compounds by soil microorganisms.FEMS Microbiol Lett. 2024 Jan 9;371:fnae041. doi: 10.1093/femsle/fnae041. FEMS Microbiol Lett. 2024. PMID: 38849295 Free PMC article.
-
CN- secondary ions form by recombination as demonstrated using multi-isotope mass spectrometry of 13C- and 15N-labeled polyglycine.J Am Soc Mass Spectrom. 2006 Aug;17(8):1181-7. doi: 10.1016/j.jasms.2006.04.031. Epub 2006 Jun 5. J Am Soc Mass Spectrom. 2006. PMID: 16750387
-
The in vivo nitrogen isotope discrimination among organic plant compounds.Phytochemistry. 2002 Nov;61(5):465-84. doi: 10.1016/s0031-9422(02)00204-2. Phytochemistry. 2002. PMID: 12409013 Review.
Cited by
-
In situ mapping of nutrient uptake in the rhizosphere using nanoscale secondary ion mass spectrometry.Plant Physiol. 2009 Dec;151(4):1751-7. doi: 10.1104/pp.109.141499. Epub 2009 Oct 7. Plant Physiol. 2009. PMID: 19812187 Free PMC article.
-
Dynamic secondary ion mass spectrometry imaging of microbial populations utilizing C-labelled substrates in pure culture and in soil.Environ Microbiol. 2009 Jan;11(1):220-9. doi: 10.1111/j.1462-2920.2008.01757.x. Epub 2008 Sep 22. Environ Microbiol. 2009. PMID: 18811644 Free PMC article.
-
Measure of carbon and nitrogen stable isotope ratios in cultured cells.J Am Soc Mass Spectrom. 2004 Apr;15(4):478-85. doi: 10.1016/j.jasms.2003.11.019. J Am Soc Mass Spectrom. 2004. PMID: 15047053
-
An underground tale: contribution of microbial activity to plant iron acquisition via ecological processes.Ann Bot. 2014 Jan;113(1):7-18. doi: 10.1093/aob/mct249. Epub 2013 Nov 20. Ann Bot. 2014. PMID: 24265348 Free PMC article. Review.
-
Heavy water and (15) N labelling with NanoSIMS analysis reveals growth rate-dependent metabolic heterogeneity in chemostats.Environ Microbiol. 2015 Jul;17(7):2542-56. doi: 10.1111/1462-2920.12752. Epub 2015 Mar 27. Environ Microbiol. 2015. PMID: 25655651 Free PMC article.
References
-
- Benninghoven, A., F. G. Rüdenauer, and H. W. Werner. 1987. Secondary ion mass spectrometry: basic concepts, instrumental aspects, applications and trends. John Wiley & Sons, Inc., New York, N.Y.
-
- Betlach, M. R., J. M. Tiedje, and R. B. Firestone. 1981. Assimilatory nitrate uptake in Pseudomonas fluorescens studied using nitrogen-13. Arch. Microbiol. 129:135-140. - PubMed
-
- Bottomley, P. J. 1994. Light microscopic methods for studying soil microorganisms, p. 81-105. In R. W. Weaver, S. Angle, P. Bottomley, D. Bezdicek, S. Smith, A. Tabatabai, A. Wollum, S. H. Mickelson, and J. M. Bigham. (ed.), Methods of soil analysis, part 2: microbiological and biochemical properties. Soil Science Society of America, Madison, Wis.
-
- Boutton, T. W., and S.-I. Yamasaki. 1996. Mass spectrometry of soils. Marcel Dekker, Inc., New York, N.Y.
-
- Bradforth, S. E., E. H. Kim, D. W. Arnold, and D. M. Neumark. 1993. Photoelectron spectroscopy of CN-, NCO-, and NCS-. J. Chem. Phys. 98:800-810.
Publication types
MeSH terms
Substances
LinkOut - more resources
Full Text Sources
