. 2002 Oct 11;277(41):38589-95.
doi: 10.1074/jbc.M206711200. Epub 2002 Jul 30.

The ferroxidase activity of yeast frataxin

Affiliations

The ferroxidase activity of yeast frataxin

Sungjo Park et al. J Biol Chem. .

Abstract

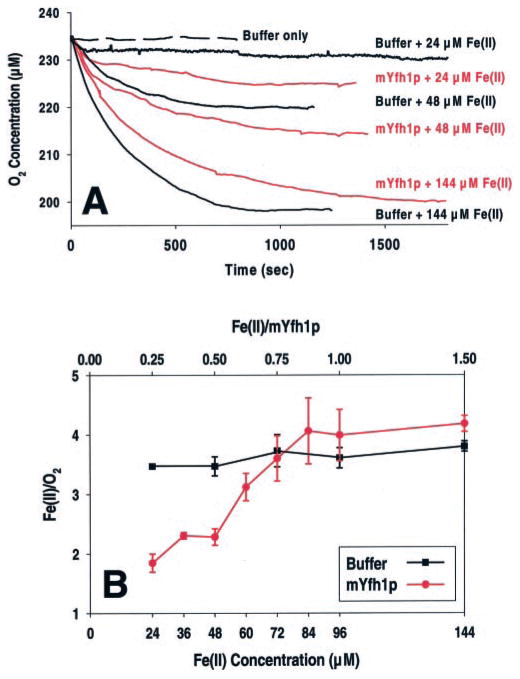
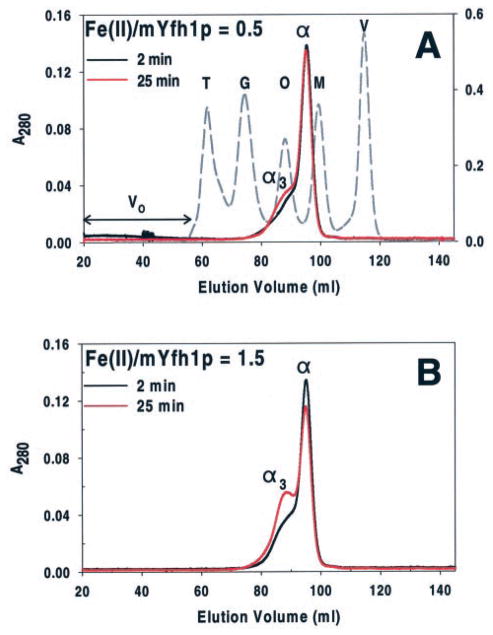
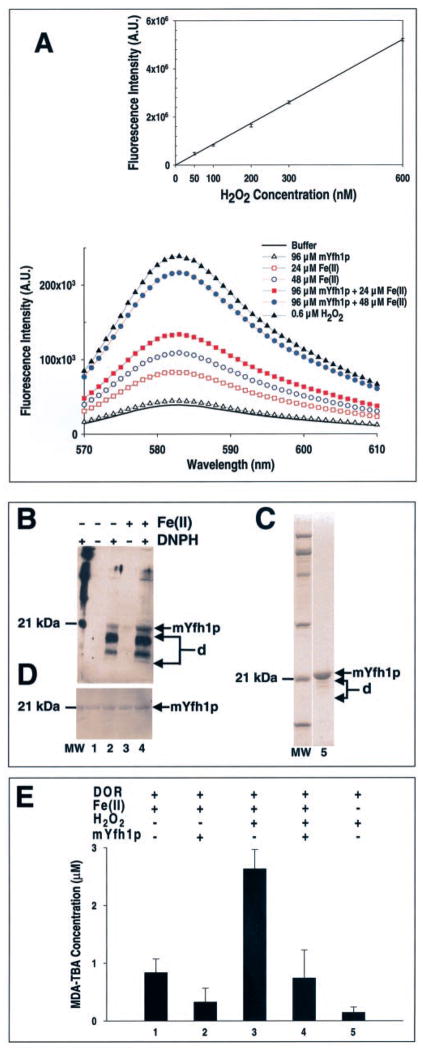
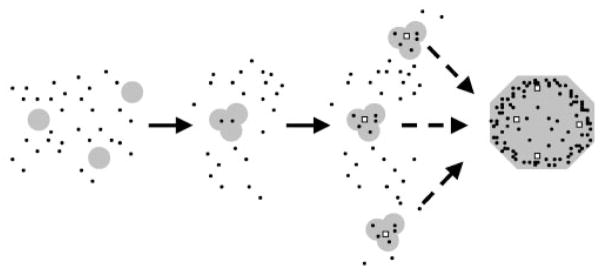
Frataxin is required for maintenance of normal mitochondrial iron levels and respiration. The mature form of yeast frataxin (mYfh1p) assembles stepwise into a multimer of 840 kDa (alpha(48)) that accumulates iron in a water-soluble form. Here, two distinct iron oxidation reactions are shown to take place during the initial assembly step (alpha --> alpha(3)). A ferroxidase reaction with a stoichiometry of 2 Fe(II)/O(2) is detected at Fe(II)/mYfh1p ratios of < or = 0.5. Ferroxidation is progressively overcome by autoxidation at Fe(II)/mYfh1p ratios of >0.5. Gel filtration analysis indicates that an oligomer of mYfh1p, alpha(3), is responsible for both reactions. The observed 2 Fe(II)/O(2) stoichiometry implies production of H(2)O(2) during the ferroxidase reaction. However, only a fraction of the expected total H(2)O(2) is detected in solution. Oxidative degradation of mYfh1p during the ferroxidase reaction suggests that most H(2)O(2) reacts with the protein. Accordingly, the addition of mYfh1p to a mixture of Fe(II) and H(2)O(2) results in significant attenuation of Fenton chemistry. Multimer assembly is fully inhibited under anaerobic conditions, indicating that mYfh1p is activated by Fe(II) in the presence of O(2). This combination induces oligomerization and mYfh1p-catalyzed Fe(II) oxidation, starting a process that ultimately leads to the sequestration of as many as 50 Fe(II)/subunit inside the multimer.


Figures

Fig. 1
Fig. 1. Ferroxidase activity of mYfh1p
A, O2 consumption curves in the presence of 96 μM mYfh1p or buffer without protein added. The conditions were 10 mM HEPES-KOH, pH 7.0, at 30 °C in the presence of 24, 48, or 144 μM Fe(II). B, O2 consumption curves were recorded in the presence of 96 μM mYfh1p and the indicated Fe(II) concentrations. The Fe(II)/O2 stoichiometry determined for each completed reaction is plotted versus the Fe(II) concentration (bottom x axis) and the Fe(II)/mYfh1p subunit ratio (top x axis). The bars represent the means ± S.D. in 2–5 (mYfh1p; red plot) or 1–11 (buffer only; black plot) independent measurements. The pH remained between 7.00 and 6.97 throughout the reactions both in the absence and the presence of mYfh1p.
Fig. 2
Fig. 2. Oligomerization of mYfh1p at low Fe(II)/mYfh1p ratios
Two sets of reactions containing 96 μM mYfh1p and 48 (A) or 144 (B) μM Fe(II) were incubated at 30 °C for 2 min (black chromatogram) or 25 min (red chromatogram) and immediately analyzed by Superdex 200 gel filtration. Peaks α and α3 denote mYfh1p monomer and trimer, respectively. Fractions corresponding to the peaks of interest were analyzed for iron concentration by inductively coupled plasma emission spectroscopy. The protein concentration in fractions corresponding to peak α3 was estimated from the decrease in peak α from 2 to 25 min (ΔA280 = A280 (2 min)A280 (25 min)). The elution profiles for mYfh1p are superimposed on that of molecular mass standards (dashed chromatogram). V, vitamin B12 (1.4 kDa); M, myoglobin (17 kDa); O, ovalbumin (44 kDa); G, gammaglobulin (158 kDa); T, thyroglobulin (669 kDa). The A280 of mYfh1p and molecular mass standards is shown on the left- and right-hand y axes, respectively. V0 denotes void volume as determined by the elution volume of blue dextran (2 MDa). As reported previously, mYfh1p monomer is eluted from gel filtration columns and migrates on SDS/PAGE (see Fig. 3C) with an apparent molecular weight of ~20,000 (23, 24), higher than the actual molecular weight of ~14,000 (23). A subunit molecular weight of 20,000 was used to estimate the number of subunits present in the ~50-kDa peak (α3) (23). Previous gel filtration analysis of mYfh1p assembly showed that coalescence of α3 into higher order intermediates to yield multimer requires concentrations of Fe(II) that exceed the iron-loading capacity of α3 (23), which is higher than the iron/subunit ratio used in Fig. 2B. This explains why no further assembly occurred under these conditions.
Fig. 3
Fig. 3. Production of H2O2 during Fe(II) oxidation in mYfh1p
A, reactions containing 96 μM mYfh1p and 24 or 48 αM Fe(II) were incubated in 50 mM HEPES-KOH, pH 7.0, for 30 min at 30 °C in the presence of Amplex Red/HRP reagent. Immediately afterward, fluorescence intensity was recorded from 570 to 610 nm. The fluorescence intensity curves before background correction are shown (bottom graph). For the standard curve (top graph), H2O2 standards (50 – 600 nM) were incubated in 50 mM HEPES-KOH, pH 7.0, for 30 min at 30 °C in the presence of Amplex Red/HRP reagent. The fluorescence intensity curves were recorded, and samples containing buffer plus Amplex Red/HRP were used for background corrections. The corrected fluorescence intensity curves were integrated, and a standard curve was constructed. The correlation coefficient of the fitted line to the data is 0.999. To determine the concentration of H2O2 produced in the presence of mYfh1p (see “Results”), samples containing buffer plus 24 or 48 μM Fe(II) and Amplex Red/HRP were used as blanks for background corrections. The corrected fluorescence intensity curves for mYfh1p were integrated, and the H2O2 concentration was calculated from the standard curve. A.U., arbitrary units. B, reactions containing 96 μM mYfh1p were incubated for 30 min at 30 °C in the absence or presence of 48 μM Fe(II) under the experimental conditions used in the Amplex Red/HRP assays described above. Following incubation with 2,4-dinitrophenylhy-drazine (DNPH) to derivatize carbonyl groups to DNP, the samples (7.5 μg of total protein) were analyzed by SDS/PAGE and Western blotting using a polyclonal anti-DNP antiserum. C, 2 μg of the purified mYfh1p monomer used in the experiments described above was analyzed by SDS/PAGE and Coomassie Blue staining (lane 5). D, following immunodetection, the membrane was subjected to SYPRO Ruby protein blot staining. Arrows d, degradation products of mYfh1p; lane MW, molecular mass standards. E, a mixture of 48 μM Fe(II), 24 μM H2O2, and 5 mM 2-deoxyribose (DOR) was incubated in 10 mM HEPES-KOH, pH 7.0, in the absence or presence of 96 μM mYfh1p for 30 min at 30 °C, and production of malondialdehyde-thiobarbituric acid (MDA-TBA) (ε532 = 1.54 × 10⁵ M−1 cm−1) was measured (31). The indicated controls were analyzed at the same time and treated identically. The bars represent the means ± S.D. of four independent measurements.
Fig. 4
Fig. 4. Inhibition of mYfh1p multimer assembly under anaerobic conditions
TSK-GEL G4000SW gel filtration of 80 μM argon-treated monomer without any added Fe(II) (light blue chromatogram) or 80 μM argon-treated monomer incubated aerobically (red chromatogram) or anaerobically (black chromatogram) in the presence of 3.2 mM Fe(II) (Fe(II)/mYfh1p = 40/1) (23) as described under “Experimental Procedures.” Peaks α and α48 represent mYfh1p monomer and multimer, respectively. The A280 of peak α48 is much higher than that of peak α because of the absorbance of iron oxides (23). The molecular weight markers (dashed chromatogram) are as in the legend of Fig. 2. The A280 of mYfh1p and the molecular weight standards is shown by the left- and right-hand y axes, respectively. V0 denotes void volume as determined by the elution volume of blue dextran (2 MDa).
Fig. 5
Fig. 5. Postulated assembly and Fe(II) oxidation pathway of mYfh1p multimer
The black dots symbolize free and protein-bound Fe(II) that is progressively oxidized to Fe(III) inside the protein. Because Fe(II) is in large excess of mYfh1p, ferroxidation is expected to be rapidly overcome by autoxidation. The open squares symbolize the nucleation sites upon which autoxidation may occur (see text for details).

References

    1. Petrat F, de Groot H, Rauen U. Biochem J. 2001;356:61–69. - PMC - PubMed
    1. Tangeras A. Biochim Biophys Acta. 1985;843:199–207. - PubMed
    1. Darnell J, Lodish H, Baltimore D. Molecular Cell Biology. Scientific American Books; New York: 1990. pp. 583–616.
    1. Halliwell B, Gutteridge JMC. Free Radicals in Biology and Medicine. Oxford University Press; Oxford, UK: 1999. pp. 1–34.
    1. Flatmark T, Romslo I. J Biol Chem. 1975;250:6433–6438. - PubMed

Publication types