. 2002 Aug;120(2):173-89.
doi: 10.1085/jgp.20028627.

Elimination of the BK(Ca) channel's high-affinity Ca(2+) sensitivity

Affiliations

Elimination of the BK(Ca) channel's high-affinity Ca(2+) sensitivity

Lin Bao et al. J Gen Physiol. 2002 Aug.

Abstract

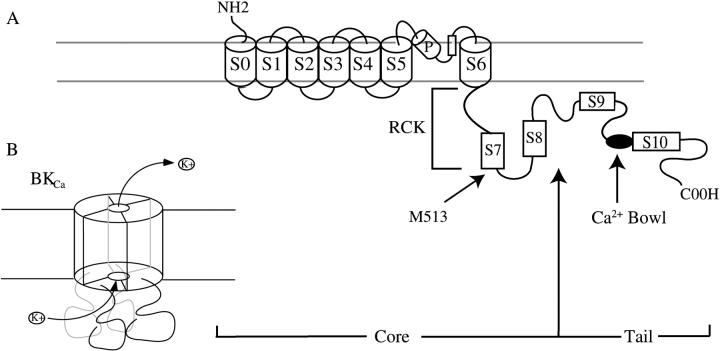
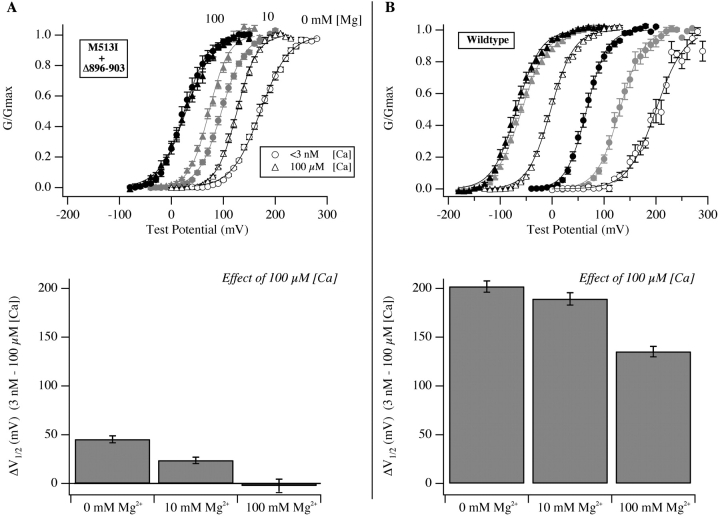
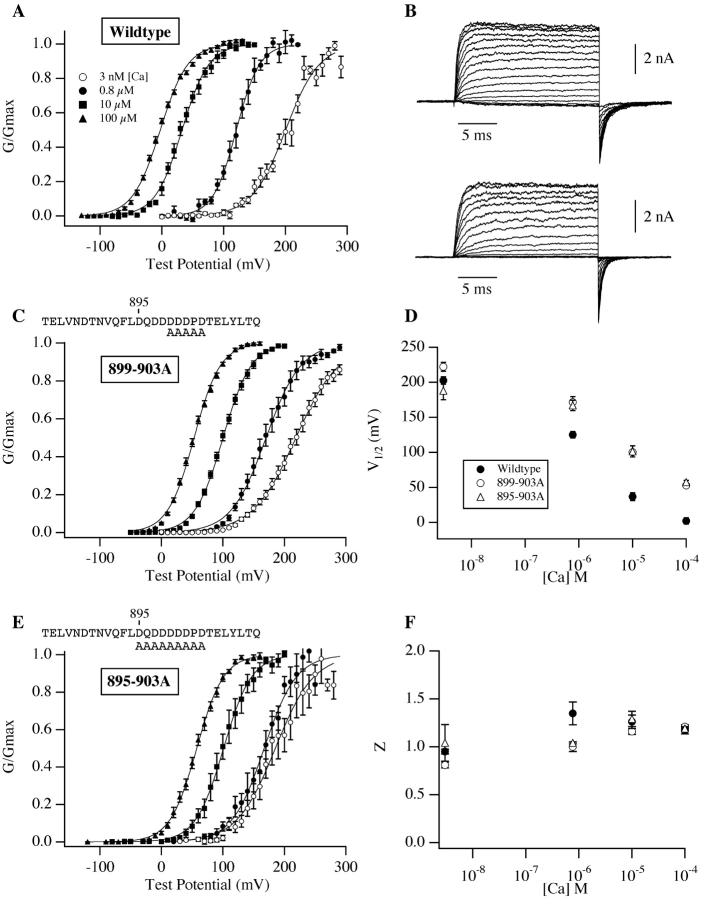
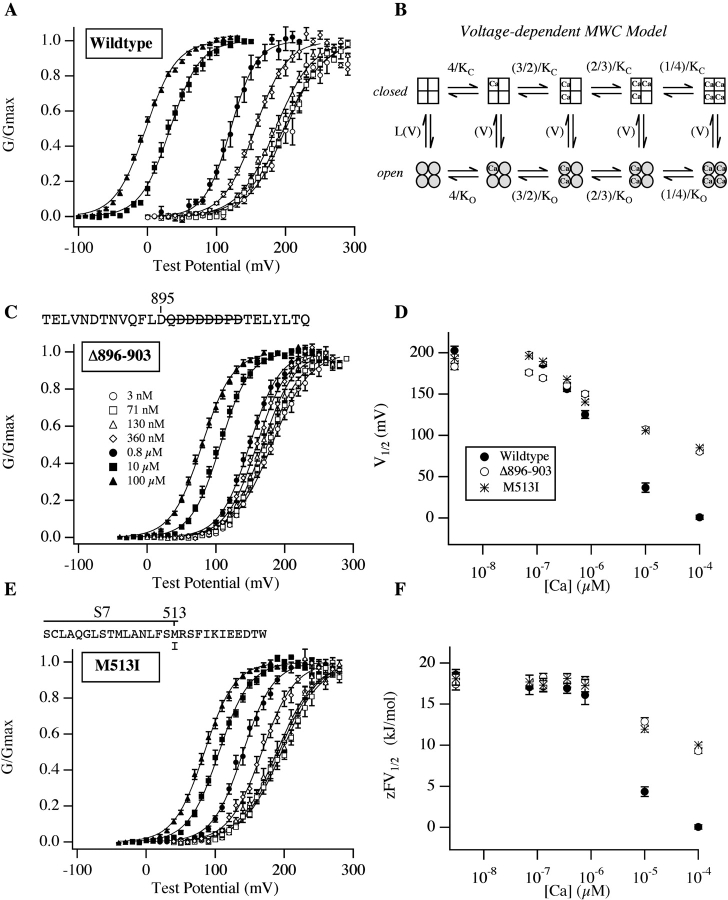
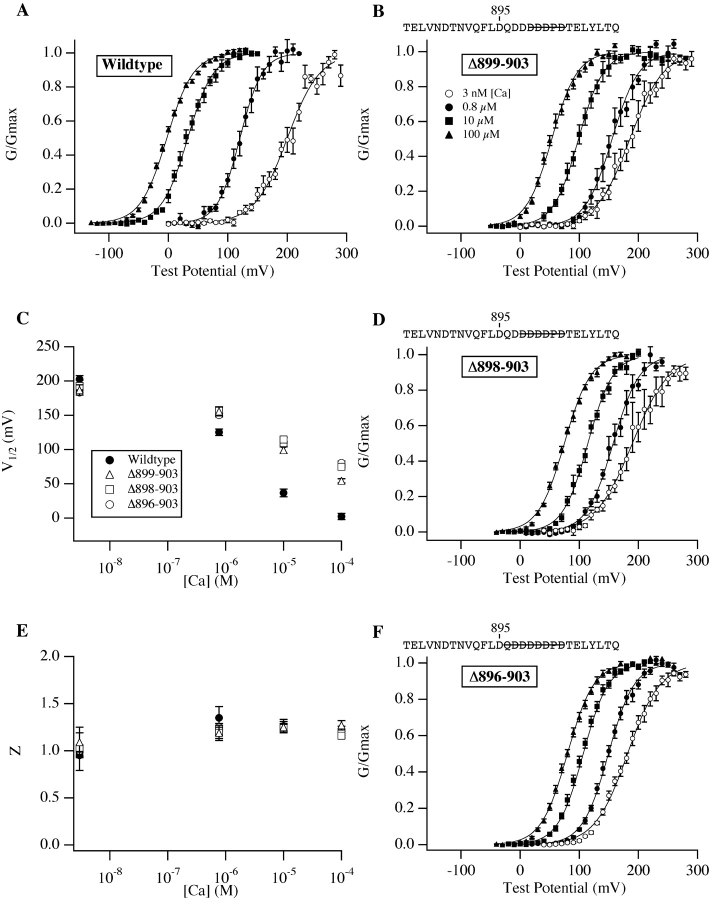
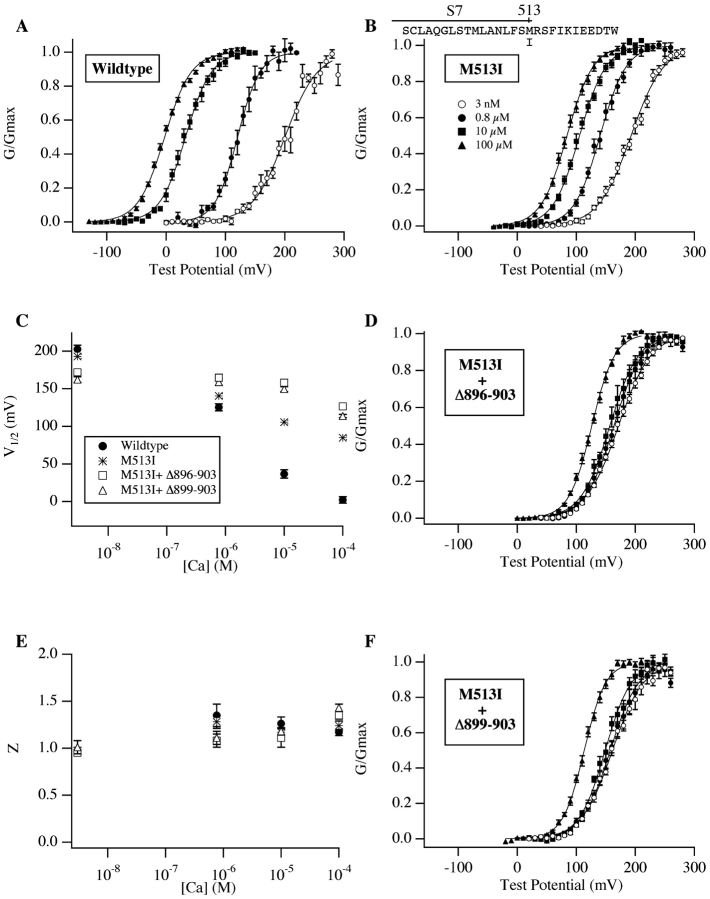
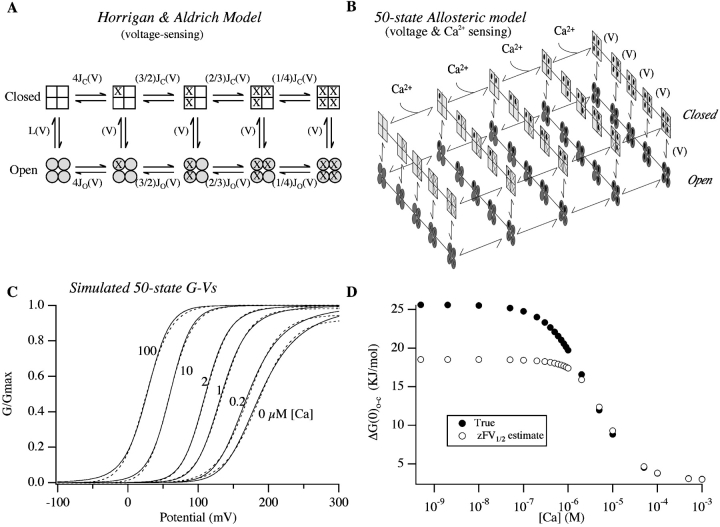
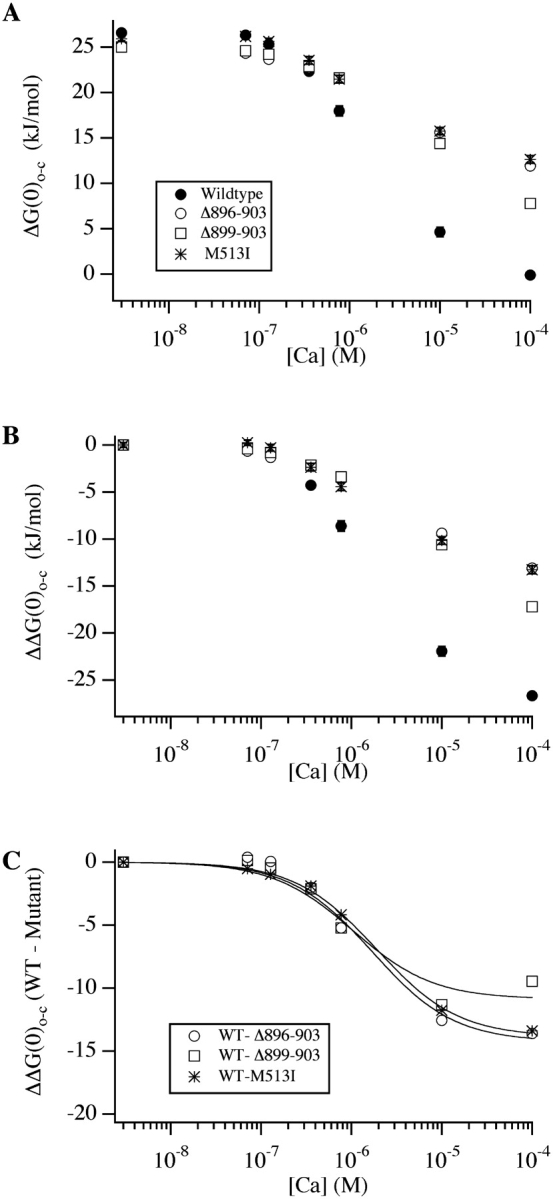
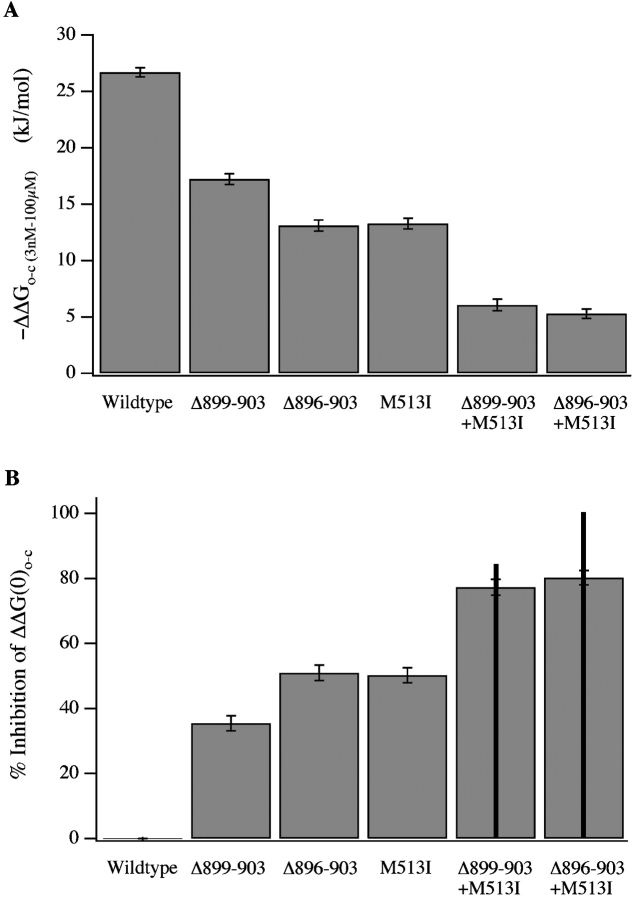
We report here a combination of site-directed mutations that eliminate the high-affinity Ca(2+) response of the large-conductance Ca(2+)-activated K(+) channel (BK(Ca)), leaving only a low-affinity response blocked by high concentrations of Mg(2+). Mutations at two sites are required, the "Ca(2+) bowl," which has been implicated previously in Ca(2+) binding, and M513, at the end of the channel's seventh hydrophobic segment. Energetic analyses of mutations at these positions, alone and in combination, argue that the BK(Ca) channel contains three types of Ca(2+) binding sites, one of low affinity that is Mg(2+) sensitive (as has been suggested previously) and two of higher affinity that have similar binding characteristics and contribute approximately equally to the power of Ca(2+) to influence channel opening. Estimates of the binding characteristics of the BK(Ca) channel's high-affinity Ca(2+)-binding sites are provided.


Figures

F<sc>igure</sc> 1.
Figure 1.
Schematic diagrams of the BKCa channel. (A) Diagram of the Slo subunit, four of which form a fully functional BKCa channel. Indicated are the core and tail domains, the pore helix (P), hydrophobic regions (S1-S10), the RCK domain, and the Ca2+-bowl. (B) Schematic diagram of a Slo tetramer.
F<sc>igure</sc> 5.
Figure 5.
The remaining Ca2+ response of M513I+Δ896–903 is blocked by Mg2+. (A) Top, G-V curves for the double mutant M513I+Δ896–903. Circles represent <3 nM [Ca2+]. Triangles represent 100 μM [Ca2+]. Open symbols indicate the absence of Mg2+. Grayed symbols indicate the presence of 10 mM [Mg2+]. Darkened symbols indicate the presence of 100 mM [Mg2+]. Each curve has been fitted with a Boltzmann function. Bottom, plots of the change in V1/2 as [Ca2+] is increased from <3 nM to 100 μM in the presence of either 0, 10, or 100 mM [Mg2+]. (B) Same experiment as in A except the wild-type channel was used. Mean V1/2 values were determined from Boltzmann fits to the data from each experiment individually.
F<sc>igure</sc> 2.
Figure 2.
Ca2+ bowl mutations reduce mSlo's Ca2+ response. (A) G-V relations determined from inside-out Xenopus oocyte macropatches expressing the mSlo protein. [Ca2+] are as indicated on the figure. (B) Wild-type (top) and mutant (895–903A; bottom) mSlo current families recorded with voltage steps to between −40 and 130 mV with 100 μM internal [Ca2+]. Tail potentials are −80 mV; holding potentials are −120 mV (top) and −100 mV (bottom). (C) G-V relations determined from patches expressing the Ca2+ bowl mutant 899–903A. The residues mutated to alanine are indicated above the plot. (D) Half maximal activation voltage (V1/2) vs. [Ca2+] plots for the data in panels A, C, and E. The points plotted are average parameter values determined from experiments fitted individually with a Boltzmann function (see Table I for values). Symbols represent channel type as indicated on the figure. (E) G-V relations determined from patches expressing the Ca2+ bowl mutant 895–903A. (F) Apparent gating valence (z), determined from Boltzmann fits, plotted as a function of [Ca2+] (see Table I for values). Symbols represent channel type as in D. Error bars in this and subsequent figures represent standard error of the mean.
F<sc>igure</sc> 6.
Figure 6.
Estimating ΔG(0)o-c based on the VD-MWC model. (A, C, and E) Wild-type and mutant G-V curves for the indicated mutants determined over an expanded series of [Ca2+] as indicated in C. (B) Diagram of the voltage-dependent MWC model (Cox et al., 1997). Horizontal transitions represent Ca2+ binding. Vertical transitions represent the conformational change by which the channel opens. K C and K O represent the model's closed and open-state Ca2+ dissociation constants, respectively. (D) V1/2 vs. [Ca2+] plots for the data in A, C, and E (see Table I for values). (F) zFV1/2 vs. [Ca2+] plots for the data in A, C, and E. Mean values of z and V1/2 were determined from fits to individual experiments separately and are listed in Table I. For the VD-MWC model, zFV1/2 = ΔG(0)o-c. Symbols indicate channel type as in D.
F<sc>igure</sc> 3.
Figure 3.
Many Ca2+ bowl mutants behave similarly. (A) Wild-type G-V relations determined at a series of [Ca2+] as in Fig. 2. (B) G-V relations for the mutant Δ899–903. The residues deleted are indicated above the plot with a line drawn through them. (C) V1/2 vs. [Ca2+] plots for the channels in A, B, D, and F (see Table I for values). (D) G-V relations for the mutant Δ898–903. (E) z vs. [Ca2+] plots for the channels in A, B, D, and F (see Table I for values). Symbols represent mutants as indicated in C. (F) G-V relations for the mutant Δ896–903. In A, B, D, and F symbols represent [Ca2+] as indicated in B.
F<sc>igure</sc> 4.
Figure 4.
Double mutants that eliminate mSlo's high-affinity Ca2+ response. (A) Wild-type G-V relations. (B) G-V relations over a series of [Ca2+] for the mutant M513I. (C) V1/2 vs. [Ca2+] plots for the channels in A, B, D, F (see Table I for values). Symbols represent mutants as indicated on the figure. (D) G-V relations for the double mutant M513I+Δ896–903. (E) z vs. [Ca2+] plots (see Table I for values). Symbols represent mutants as indicated in C. (F) G-V relations for the double mutant M513I+Δ899–903. In A, B, D, and F symbols represent [Ca2+] as indicated in B.
F<sc>igure</sc> 7.
Figure 7.
A more complex model of mSlo gating suggests errors in our ΔG(0)o-c estimates at low [Ca2+]. (A). Diagram of the model Horrigan et al. (1999) used to described the voltage-dependent gating of the mSlo channel. Horizontal transitions represent voltage sensor activation. Vertical transitions represent the conformational change by which the channel opens. J C(V) and J O(V) are the equilibrium constants for voltage-sensor activation when the channel is either closed or open where: J C(V) = J C(0)exp(zFV/RT) and JO(V) = J O(0)exp(zFV/RT); and L(V) is the equilibrium constant between open and closed when no voltage sensors are active and no Ca2+ is bound where: L(V) = L(0)exp(qFV/RT). (B) 50-state mSlo model. Here Ca2+ binding occurs along the long horizontal axis, voltage sensor movement along the short horizontal axis, and transitions from the upper to the lower tier indicate channel opening. The front face of this scheme corresponds to the model in A. (C) Simulated G-V curves from the model in B at the [Ca2+] indicated on the figure. For more discussion of this model see (Cox and Aldrich, 2000; Cui and Aldrich, 2000; Rothberg and Magleby, 2000). Parameters were as follows: J C(0) = 0.066; J O(0) = 1.10; z = 0.51; L(0) = 2e-6; q = 0.4; K C = 10 μM, K O = 1 μM. Each curve is fitted with a Boltzmann function (dashed lines). (D) Plots of ΔG(0)o-c as a function of [Ca2+] for the model in C. Darkened circles indicate the true ΔG(0)o-c of the model calculated as 4RTln[(1+ [Ca]/K C)/(1 + [Ca]/K O)] + 4RTln[(1 + J C(0))/(1 + J O(0))] − RTln[L(0)], while the open circles represent estimates obtained from Boltzmann-fit parameters as zFV1/2.
F<sc>igure</sc> 8.
Figure 8.
Energetics of Ca2+ binding to mutant and wild-type mSlo channels. (A) Estimates of ΔG(0)o-c as a function of [Ca2+] obtained by fitting each experiment with Eq. 2 and then calculating ΔG(0)o-c from Eq. 3. Constant parameters were: J C(0) = 0.059, J O(0) = 1.020, z = 0.51, q = 0.4. Symbols indicate channel type as indicated on the plot. (B) The curves in A have been shifted so each curve has a value of 0 at 3 nM [Ca2+]. (C) WT-mutant difference curves. Each mutant's curve in B has been subtracted from the wild-type curve in B to create difference curves that indicate the properties of the site disrupted by each mutation. Error bars, which represent standard error of the mean, are included in A and B; they are often smaller than the plot symbols.
F<sc>igure</sc> 9.
Figure 9.
Additivity of mutations. (A) −ΔΔG(0)o-c (3 nM to 100 μM [Ca2+]) is plotted for each channel type. (B) For each channel type is plotted (ΔΔG(0)o-c (3 nM to 100 μM [Ca2+])wild-type − ΔΔG(0)o-c (3 nM to 100 μM [Ca2+])mutant)/ΔΔG(0)o-c (3 nM to 100 μM [Ca2+])wild-type,, which is the percent reduction in response to 100 μM [Ca2+] caused by each mutation. Vertical black lines indicate the predictions of strict additivity, and are thus the sums of the bars for each individual mutant that contributes to a double mutant.

References

    1. Adelman, J.P., K.Z. Shen, M.P. Kavanaugh, R.A. Warren, Y.N. Wu, A. Lagrutta, C.T. Bond, and R.A. North. 1992. Calcium-activated potassium channels expressed from cloned complementary DNAs. Neuron. 9:209–216. - PubMed
    1. Barrett, J.N., K.L. Magleby, and B.S. Pallotta. 1982. Properties of single calcium-activated potassium channels in cultured rat muscle. J. Physiol. 331:211–230. - PMC - PubMed
    1. Bers, D., C. Patton, and R. Nuccitelli. 1994. A practical guide to the preparation of Ca2+ buffers. Methods Cell Biol. 40:3–29. - PubMed
    1. Bian, S., I. Favre, and E. Moczydlowski. 2001. Ca2+-binding activity of a COOH-terminal fragment of the Drosophila BK channel involved in Ca2+-dependent activation. Proc. Natl. Acad. Sci. USA. 98:4776–4781. - PMC - PubMed
    1. Branden, C., and J. Tooze. 1991. Enzymes that bind nucleotides. In Introduction to Protein Structure. New York, Garland Publishing. 141–159.

Publication types

MeSH terms

Substances