. 2002 Aug;120(2):237-47.
doi: 10.1085/jgp.20028604.

Modeling tight junction dynamics and oscillations

Affiliations

Modeling tight junction dynamics and oscillations

Fuad Kassab Jr et al. J Gen Physiol. 2002 Aug.

Abstract

Tight junction (TJ) permeability responds to changes of extracellular Ca(2+) concentration. This can be gauged through changes of the transepithelial electrical conductance (G) determined in the absence of apical Na(+). The early events of TJ dynamics were evaluated by the fast Ca(2+) switch assay (FCSA) (Lacaz-Vieira, 2000), which consists of opening the TJs by removing basal calcium (Ca(2+)(bl)) and closing by returning Ca(2+)(bl) to normal values. Oscillations of TJ permeability were observed when Ca(2+)(bl) is removed in the presence of apical calcium (Ca(2+)(ap)) and were interpreted as resulting from oscillations of a feedback control loop which involves: (a) a sensor (the Ca(2+) binding sites of zonula adhaerens), (b) a control unit (the cell signaling machinery), and (c) an effector (the TJs). A mathematical model to explain the dynamical behavior of the TJs and oscillations was developed. The extracellular route (ER), which comprises the paracellular space in series with the submucosal interstitial fluid, was modeled as a continuous aqueous medium having the TJ as a controlled barrier located at its apical end. The ER was approximated as a linear array of cells. The most apical cell is separated from the apical solution by the TJ and this cell bears the Ca(2+) binding sites of zonula adhaerens that control the TJs. According to the model, the control unit receives information from the Ca(2+) binding sites and delivers a signal that regulates the TJ barrier. Ca(2+) moves along the ER according to one-dimensional diffusion following Fick's second law. Across the TJ, Ca(2+) diffusion follows Fick's first law. Our first approach was to simulate the experimental results in a semiquantitative way. The model tested against experiment results performed in the frog urinary bladder adequately predicts the responses obtained in different experimental conditions, such as: (a) TJ opening and closing in a FCSA, (b) opening by the presence of apical Ca(2+) and attainment of a new steady-state, (c) the escape phase which follows the halt of TJ opening induced by apical Ca(2+), (d) the oscillations of TJ permeability, and (e) the effect of Ca(2+)(ap) concentration on the frequency of oscillations.


Figures
F<sc>igure</sc> 1.
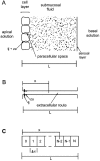
Figure 1.
(A) Diagram of a transversal section through a frog urinary bladder showing (out of scale) the epithelial layer having a thickness of ∼10 μm and the submucosa that consists of a delicate stroma of fibroblasts and collagen fibers, blood and lymph vessels, nerves, and smooth muscle bundles embedded in the submucosal fluid, with a total thickness of ∼100 μm. (B) Simplified schematic representation of the extracellular route which comprises the paracellular space in series with the submucosal fluid. The extracellular route is presented as an aqueous unstirred compartment having one end in contact with the apical solution and the other with the basal solution. The tight junction (TJ) is represented as a gate which controls access to the apical opening of the extracellular route. Near the TJ are depicted the Ca2+ binding sites of the zonula adhaerens (za). (C) Modeling of diagram B as a linear array of cells (0, 1, 2, … N).
F<sc>igure</sc> 2.
Figure 2.
(A) Schematic representation of the feedback loop involved in the control of the tight junction barrier with its main components: (a) the sensor is the Ca2+ binding sites of zonula adhaerens (za); (b) the control unit is the cell machinery involved in the cell signaling process; and (c) the effector is the TJ barrier. The black arrows indicate the direction of information flow from za to the TJ. (B) Block diagram representing the function of each component of the feedback loop shown in (A) as well as the flow of signals. See results, The Model, for explanation.
F<sc>igure</sc> 3.
Figure 3.
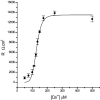
Mean steady-state values for transepithelial electrical resistance (R) as a function of Ca2+ concentration in both apical and basal bathing solutions for 4 different frog urinary bladder preparations. The basal solution was NaCl-Ringer's and the apical solution KCl 75 mM with the same Ca2+ concentration as that of the basal solution. Na+ was removed from the apical solution in order to reduce the contribution of transcellular electrical conductance to the overall tissue electrical conductance. Data points were fitted according to the Hill equation (Eq. 9) (see results, The Model).
F<sc>igure</sc> 4.
Figure 4.
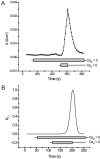
(A) Representative experiment of an FCSA performed in a fragment of frog urinary bladder. At the start of the experiment, tissue was bathed on the apical side by KCl 75 mM containing 1 mM Ca2+ and on the basal side by NaCl-Ringer's solution. Then, 100 s after the beginning of the record, Ca2+ was removed from the apical solution and no effect was observed on G. Finally, Ca2+ was removed from the basal solution and subsequently reintroduced according to the protocol of an FCSA. As observed, G increases when Ca2+ bl = 0 mM and recovers when Ca2+ bl = 1 mM. (B) Model prediction for G in response to apical Ca2+ removal followed by a simulation of a FCSA which consists of Ca2+ removal and subsequent addition to the basal solution. Parameters and variables: dx = 3 μm; K = 1.5 s−1; θ = 5 s; Ca2+ ap = 1 mM (t = 0 s); Ca2+ ap = 0 mM (t = 50 s); Ca2+ bl = 0 mM (t = 120 s); Ca2+ bl = 1 mM (t = 190 s). KTJ is normalized to its maximum value.
F<sc>igure</sc> 5.
Figure 5.
Tissue steady-state electrical conductance (G) as a function of the Ca2+ concentration in the bathing solutions. Curve on the left was generated using the parameters calculated from data of Fig. 3. Curve on the right was generated using the same parameters except Km that was increased to 1 mM.
F<sc>igure</sc> 6.
Figure 6.
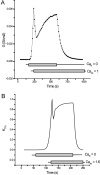
(A) Representative experiment on the effect of apical Ca2+ addition on the response to an FCSA. Effect of adding Ca2+ to the apical bathing solution at 1 mM concentration after G had increased in response to Ca2+ bl removal. In this case, the presence of apical Ca2+ induced a halt in the process of TJ opening followed by partial recuperation of G, which is then accompanied by a escape phase, characterized by a later increase of G toward a new steady-state. (B) Model prediction for G in response to apical Ca2+ addition. Parameters and variables: dx = 3 μm; K = 1.07 s−1; θ = 5 s; Ca2+ bl = 0 mM (t = 50 s); Ca2+ ap =1.6 mM (t = 120 s); Ca2+ bl = 1 mM (t = 200 s). KTJ is normalized to its maximum value.
F<sc>igure</sc> 7.
Figure 7.
(A) Representative experiment on the effect of apical Ca2+ addition on the response to an FCSA. Effect of adding Ca2+ to the apical bathing solution at 5 mM concentration after G had increased in response to Ca2+ bl removal. In this case, the presence of apical Ca2+ induced a halt in the process of TJ opening followed by partial recuperation of G which stabilize in a new steady-state. (B) Model prediction for G in response to apical Ca2+ addition. Parameters and variables: dx = 3 μm; K = 1 s−1 ; θ = 0.5 s; Ca2+ bl = 0 mM (t = 50 s); Ca2+ ap = 3.3 mM (t = 120 s). KTJ is normalized to its maximum value.
F<sc>igure</sc> 8.
Figure 8.
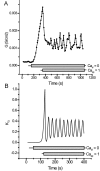
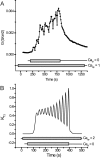
(A) Representative experiment on the effect of apical Ca2+ addition on the response to an FCSA. Effect of adding Ca2+ to the apical bathing solution at 1 mM concentration after G had increased in response to Ca2+ bl removal. In this case, the presence of apical Ca2+ induced a halt in the process of TJ opening followed by partial recuperation of G that is accompanied by oscillations of G. (B) Model prediction for G in response to apical Ca2+ addition. Parameters and variables: dx = 3 μm; K = 8 s−1; θ = 10 s; Ca2+ bl = 0 mM (t = 50 s); Ca2+ ap = 1 mM (t = 120 s). KTJ is normalized to its maximum value.
F<sc>igure</sc> 9.
Figure 9.
(A) Representative experiment on the effect of the previous presence of apical Ca2+ on the time course of G increase in response to an FCSA. Ca2+ ap was already present at 1 mM concentration when the FCSA was induced by removing Ca2+ bl. In this case, due to the presence of apical Ca2+, the FCSA induced oscillations which started soon after Ca2+ bl was removed. These oscillations increased in amplitude until a steady-state is reached. (B) Model prediction for G in response to Ca2+ bl removal. Parameters and variables: dx = 3 μm; K = 5 s−1; θ = 9.25 s; Ca2+ ap = 2 mM (t = 0 s); Ca2+ bl = 0 mM (t = 50 s); Ca2+ bl = 1 mM (t = 382 s). KTJ is normalized to its maximum value.
F<sc>igure</sc> 10.
Figure 10.
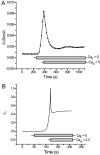
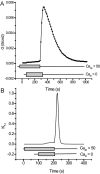
(A) Representative experiment on the effect of the previous presence of apical Ca2+ at high concentration on the time course of G increase in response to an FCSA. Ca2+ ap was already present at 50 mM concentration. Ca2+ bl removal caused a small increase in conductance. Afterwards, Ca2+ ap was removed inducing a fast rising increase of G, with a short latency period. Soon after, Ca2+ bl was raised to 1 mM, causing a recovery of the TJ seal. (B) Model prediction for G in response to to a situation equivalent to that in A. Parameters and variables: dx = 3 μm; K = 1.5 s−1; θ = 5 s; Ca2+ ap = 50 mM (t = 0 s); Ca2+ bl = 0 mM (t = 100 s); Ca2+ ap = 0 (t = 200); Ca2+ bl = 1 (t = 210). KTJ is normalized to its maximum value.

Similar articles

Cited by

References

    1. Balda, M.S., M.B. Fallon, C.M. Van Itallie, and J.M. Anderson. 1992. Structure, regulation, and pathophysiology of tight junctions in the gastrointestinal tract. Yale J. Biol. Med. 65:725–735. - PMC - PubMed
    1. Byrne, J.H., and S.G. Schultz. 1988. An Introduction to Membrane Transport and Bioelectricity. Raven Press, New York. 1–232.
    1. Castro, J.A., A. Sesso, and F. Lacaz-Vieira. 1993. Deposition of BaSO4 in the tight junctions of amphibian epithelia causes their opening; apical Ca2+ reverses this effect. J. Membr. Biol. 134:15–29. - PubMed
    1. Cereijido, M., L. González-Mariscal, G. Avila, and R.G. Contreras. 1988. Tight junctions. CRC Crit. Rev. Anat. Sci. 1:171–192. - PubMed
    1. Cereijido, M., L. Shoshani, and R.G. Contreras. 2000. Molecular physiology and pathophysiology of tight junctions. I. Biogenesis of tight junctions and epithelial polarity. Am. J. Physiol. Gastrointest. Liver Physiol. 279:G477–G482. - PubMed

Publication types