. 2002 Aug;120(2):249-60.
doi: 10.1085/jgp.20028591.

Uncoupling of gating charge movement and closure of the ion pore during recovery from inactivation in the Kv1.5 channel

Affiliations

Uncoupling of gating charge movement and closure of the ion pore during recovery from inactivation in the Kv1.5 channel

Zhuren Wang et al. J Gen Physiol. 2002 Aug.

Abstract

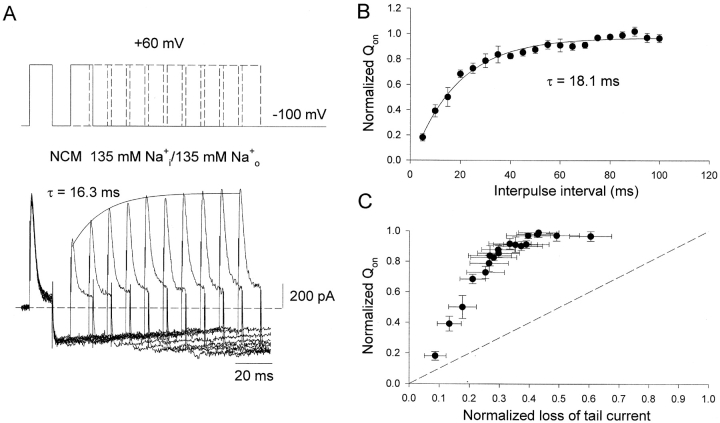
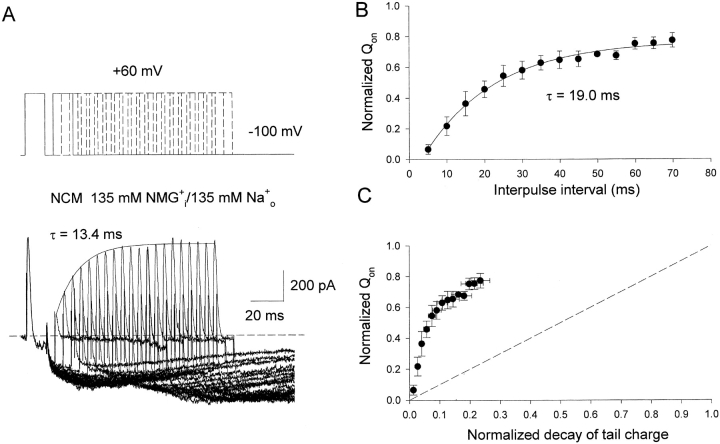
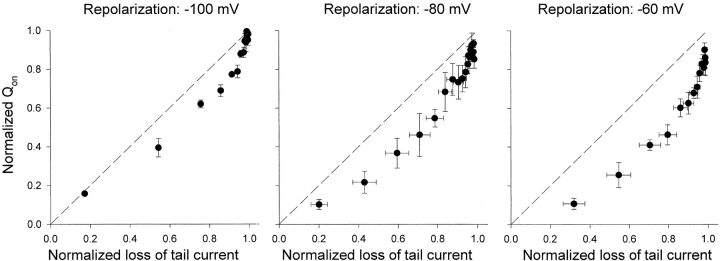
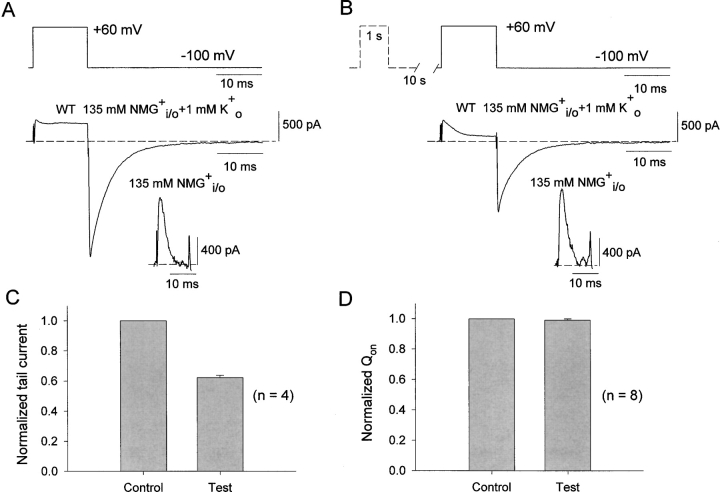
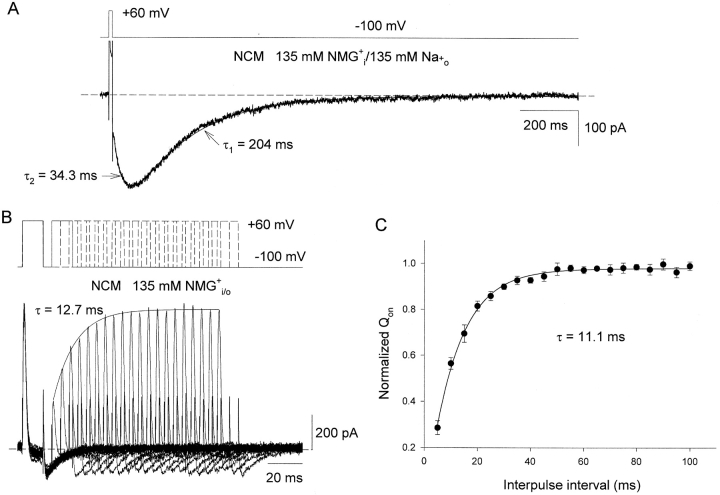
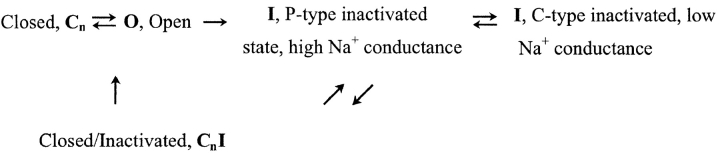
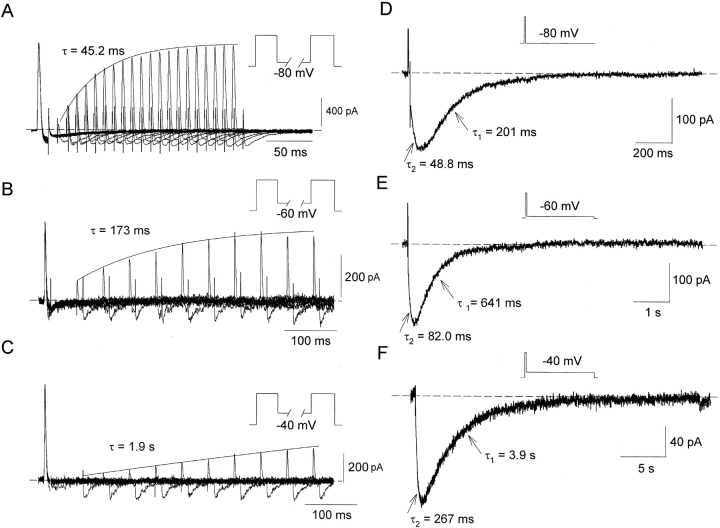
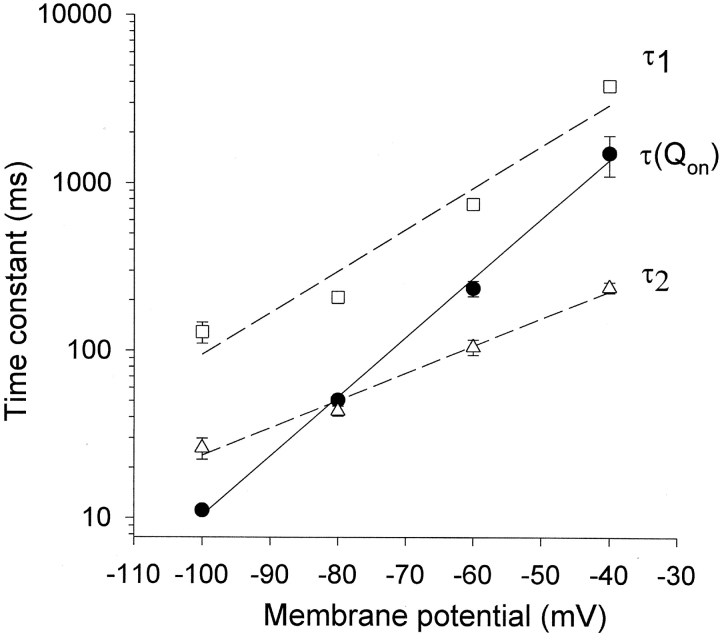
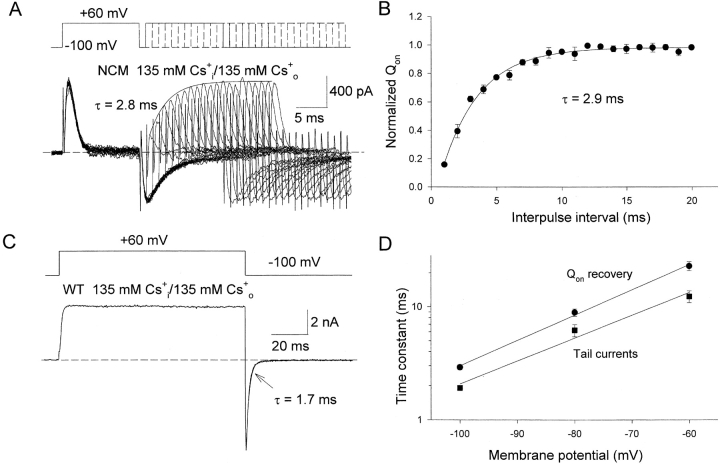
Both wild-type (WT) and nonconducting W472F mutant (NCM) Kv1.5 channels are able to conduct Na(+) in their inactivated states when K(+) is absent. Replacement of K(+) with Na(+) or NMG(+) allows rapid and complete inactivation in both WT and W472F mutant channels upon depolarization, and on return to negative potentials, transition of inactivated channels to closed-inactivated states is the first step in the recovery of the channels from inactivation. The time constant for immobilized gating charge recovery at -100 mV was 11.1 +/- 0.4 ms (n = 10) and increased to 19.0 +/- 1.6 ms (n = 3) when NMG(+)(o) was replaced by Na(+)(o). However, the decay of the Na(+) tail currents through inactivated channels at -100 mV had a time constant of 129 +/- 26 ms (n = 18), much slower than the time required for gating charge recovery. Further experiments revealed that the voltage-dependence of gating charge recovery and of the decay of Na(+) tail currents did not match over a 60 mV range of repolarization potentials. A faster recovery of gating charge than pore closure was also observed in WT Kv1.5 channels. These results provide evidence that the recovery of the gating elements is uncoupled from that of the pore in Na(+)-conducting inactivated channels. The dissociation of the gating charge movements and the pore closure could also be observed in the presence of symmetrical Na(+) but not symmetrical Cs(+). This difference probably stems from the difference in the respective abilities of the two ions to limit inactivation to the P-type state or prevent it altogether.


Figures

F<sc>igure</sc> 6.
Figure 6.
Relationship between the gating charge recovery and the channel closure in Kv1.5 NCM channels in the presence of 135 mM Na+ i/o. (A) Top, the same double-pulse protocol as shown in Fig. 3 A. Bottom, superimposed whole cell current traces elicited by the protocol shown at the top. Currents were recorded with symmetrical 135 mM Na+ i/o solutions. The solid line is the single exponential fitting to the peak of on-gating current with a time constant (τ) of 16.3 ms. The dotted line represents the zero current level. (B) Fractional recovery of Qon (Qon test/Qon prepulse) plotted as a function of interpulse interval. Data points represent means ± SEM (n = 3). The solid line is the best fit to data points using a single exponential function with τ = 18.1 ± 1.3 ms (n = 3). (C) Fractional recovery of Qon is plotted as a function of the loss of Na+ tail currents, the latter is normalized to the peak inward current. The dotted line represents a linear relationship between charge recovery and channel closing, with a slope of 1.0.
F<sc>igure</sc> 3.
Figure 3.
Effects of 135 mM Na+ o on the relation between charge recovery and pore closure in inactivated Kv1.5 NCM channels. (A) Top, double-pulse protocol includes two identical 12-ms pulses to 60 mV separated by a variable interpulse interval from 5 to 100ms with increments of 5 ms. Cells were held at −100 mV for 2 s between pairs of pulses. Bottom, superimposed whole cell current traces elicited by the protocol shown at the top. Currents were recorded with 135 mM NMG+ i/135 mM Na+ o solutions to record on-gating currents and inward Na+ tail currents at −100 mV. Solid line is the single exponential fitting to the peak of on-gating currents (τ = 13.4 ms). The dotted line represents the zero current level. (B) Fractional recovery of Qon (Qon test/Qon prepulse) plotted as a function of interpulse interval. Data points represent means ± SEM from four cells, and the solid line is the best fit to data points using a single exponential function with τ = 19.0 ± 1.6 ms. (C) Fractional recovery of Qon is plotted as a function of the loss of Na+ tail charge. The Na+ tail charge was obtained by integration of Na+ tail currents shown in Fig. 2 A. Data points represent means ± SEM from 4–5 cells. Dotted line represents a linear relationship between the charge recovery and the channel closure, with a slope of 1.0.
F<sc>igure</sc> 8.
Figure 8.
The relationship between gating charge recovery and channel closure in the presence of 135 mM Cs+ i/o. Fractional recovery of Qon is plotted as a function of the loss of Cs+ tail currents using data from experiments as shown on Fig. 7. Tail current loss was normalized to the peak inward Cs+ tail current, at different times during recovery, and at different repolarization potentials in the three panels. Dotted lines depict a linear relationship between charge recovery and channel pore closure. Data points represent mean ± SEM (n = 4–6), with a slope of 1.0.
F<sc>igure</sc> 1.
Figure 1.
Uncoupling between the recoveries of gating charge and channel conductance in the inactivated WT Kv1.5 channels. (A and B) Top, voltage protocols used in the experiments shown at bottom of A and B, respectively. Dotted line in protocol in B depicts a 1-s prepulse and 10-s interpulse interval given before the 12-ms test pulse. Whole cell current traces were recorded with symmetrical 135 mM NMG+ i/o and 1 mM K+ o to record K+ tail currents at −100 mV. Note that the K+ tail current in B is significantly reduced, indicating a failure to fully recover from inactivation during the 10-s interval. Inset panels show on-gating current tracings recorded in symmetrical 135 mM NMG+ i/o from the same cells. They were subjected to the same protocol as ionic currents above. Note that in this case there is no difference between on-gating current amplitudes in A and B, indicating full recovery of gating charge in B. (C) Reduction in ionic tail current during the test depolarizations compared with controls (n = 4). (D) No change in normalized on-gating charge obtained by integrating the on-gating currents during control depolarizations without a prepulse and test depolarizations after a prepulse (n = 8). The dotted lines in A and B represent the zero current level.
F<sc>igure</sc> 2.
Figure 2.
Rates of pore closure and gating charge recovery in inactivated Kv1.5 NCM channels. (A) Na+ tail current through Kv1.5 NCM channels after a 12-ms depolarization. Voltage protocol is shown at the top. The current was recorded with 135 mM NMG+ i/135 mM Na+ o solutions. The decay of the tail current was fitted by single exponential function with a time constant (τ1) of 204 ms. The dotted line represents the zero current level. (B) Superimposed on- and off-gating current traces were elicited by a double pulse to 60 mV (top) separated by a variable interpulse interval from 5 to 100 ms with increments of 5 ms each cycle. The duration of both prepulse and the test pulse was 12 ms, and the interval between pairs of pulses was 2 s at −100 mV. Currents were recorded with symmetrical 135 mM NMG+ i / NMG+ o solutions. The solid line is the best fit to the peak of On-gating currents using a single exponential function with a time constant (τ) of 12.7 ms. The dotted line represents zero current level. (C) Fractional recovery of Qon after a 12-ms prepulse. Qon was obtained by integrating on-gating currents during 12-ms pulses, normalized to that during the prepulse, and plotted as a function of interpulse interval. Data points represent means ± SEM from 10 cells. Solid line is the best fit to data points using single exponential function with a time constant (τ) of 11.1 ± 0.4 ms.
SCHEME I
SCHEME I
F<sc>igure</sc> 4.
Figure 4.
Voltage-dependence of the gating charge recovery and channel closure in the inactivated Kv1.5 NCM channels. (A–C) Superimposed gating current traces were elicited by a double pulse to 60 mV separated by a variable interpulse interval (protocol above each record). The duration of both prepulse and the test pulse was 12 ms and the interval between pairs of pulses was 2 s at –80 mV, 10 s at −60 mV and 15 s at −40 mV, respectively. Currents were recorded with symmetrical 135 mM NMG+ i/o solutions. Solid lines are the best fits to the peak of on-gating currents using a single exponential function with time constants (τ) shown on tracings. (D–F) After a 12-ms pulse to 60 mV, Na+ tail currents were recorded at −80, −60, and −40 mV, respectively. Voltage protocol is shown above each record. The current was recorded with 135 mM NMG+ i/135 mM Na+ o solutions. The tail currents were fitted by double exponential functions with time constants (τ1 and τ2) shown on tracings. Dotted lines represent zero current level.
F<sc>igure</sc> 5.
Figure 5.
Time constants of Na+ current decay and gating charge recovery versus repolarization potential. τ1 was fitted to the slower decay phase of the Na+ tail current, whereas τ2 was fitted to the rising phase, as indicated in Fig. 4. Data points represent mean ± SEM (n = 5–13). Dotted and solid lines represent the best linear fitting to data points. Qon time constants were from exponential fits to the time course of charge recovery at different potentials, obtained from data as in Fig. 4, A–C.
F<sc>igure</sc> 7.
Figure 7.
Rate of gating charge recovery and channel closure in WT Kv1.5 and NCM channels in the presence of 135 mM Cs+ i/o. (A) Top, the same double-pulse protocol as shown in Fig. 3 A. Bottom, superimposed gating current traces elicited by the protocol shown at the top. Currents were recorded with symmetrical 135 mM Cs+ i/o solutions from NCM channels. Solid line is the single exponential fitting to the peak of on-gating currents with τ = 2.8 ms. The dotted line represents the zero current level. (B) Fractional recovery of Qon (Qon test/Qon prepulse) is plotted as a function of the interpulse interval. Data points represent means ± SEM (n = 4). The solid line is the best fit to data points using a single exponential function with τ = 2.9 ± 0.1 ms. (C) Top, voltage protocol used to elicit the current below. Bottom, whole cell current through WT Kv1.5 channels with symmetrical 135 mM Cs+ i/o solutions. The tail was fitted by a single exponential function with a time constant (τ) of 1.7 ms. The dotted lines represent the zero current level. (D) Time constants of voltage-dependent deactivation (tail currents) and gating charge recovery (Qon recovery) of Kv1.5 channels in the presence of Cs+ i/o, plotted as functions of repolarization potential. Data points represent mean ± SEM (n = 4–6). Solid lines represent the linear fitting to data points.

Similar articles

Cited by

References

    1. Armstrong, C.M., and F. Bezanilla. 1973. Currents related to movement of the gating particles of the sodium channels. Nature. 242:459–461. - PubMed
    1. Bezanilla, F. 2000. The voltage sensor in voltage-dependent ion channels. Physiol. Rev. 80:555–592. - PubMed
    1. Bezanilla, F., E. Perozo, and E. Stefani. 1994. Gating of Shaker K+ channels: II. The components of gating currents and a model of channel activation. Biophys. J. 66:1011–1021. - PMC - PubMed
    1. Bezanilla, F., R.E. Taylor, and J.M. Fernández. 1982. Distribution and kinetics of membrane dielectric polarization. 1. Long-term inactivation of gating currents. J. Gen. Physiol. 79:21–40. - PMC - PubMed
    1. Burgess, D.E., O. Crawford, B.P. Delisle, and J. Satin. 2002. Mechanism of inactivation of human T-type (low-voltage actviated) calcium channels. Biophys. J. 82:1894–1906. - PMC - PubMed

Publication types