. 2002 Aug;40(8):2729-40.
doi: 10.1128/JCM.40.8.2729-2740.2002.

Ca3 fingerprinting of Candida albicans bloodstream isolates from the United States, Canada, South America, and Europe reveals a European clade

Affiliations

Ca3 fingerprinting of Candida albicans bloodstream isolates from the United States, Canada, South America, and Europe reveals a European clade

Claude Pujol et al. J Clin Microbiol. 2002 Aug.

Abstract

It was previously demonstrated by a cluster analysis that 26 unrelated U.S. isolates of Candida albicans separated into three distinct groups (groups I, II, and III) while South African isolates separated into four distinct groups (groups I, II, III, and SA). To verify the absence or underrepresentation of SA isolates in North America, and to identify which groups are represented in Europe and South America, collections of bloodstream isolates from each geographical locale were analyzed by cluster analyses based on genetic fingerprinting with the Ca3 probe. The results verify that North America is almost devoid of SA isolates (2%). However, the results reveal a new clade, designated group E, relatively specific to Europe. While 26% of a European collection of 46 isolates was composed of group E isolates, only 2% of the 164 North American isolates, 5% of 22 South American isolates, and 1% of 361 South African isolates were composed of group E isolates. The North American collection proved to be the least-diverse collection in regard to group representation. In a comparison of collections from the Northeast, Midwest, and Southwest regions of the United States, Canada, and South America, it was demonstrated that both the U.S. Southwest and the South American collections were devoid of group II isolates. Together these results identify for the first time a European-specific clade and demonstrate clear distinctions in the representations of the five demonstrated clades (groups I, II, III, SA, and E) in different geographical locales.


Figures

FIG. 1.
FIG. 1.
Reference isolates from previous studies used in mixed dendrograms to identify isolates in new collections that are members of groups I, II, III, and SA. (A) A dendrogram of the collection of 26 isolates from the United States originally characterized by Pujol et al. (9) in the identification of groups I, II, and III. (B) A dendrogram of the collection of 21 isolates from healthy black South Africans attending the Medunsa Clinic in South Africa characterized by Blignaut et al. (3), which contains group SA isolates in addition to group I, II, and III isolates. (C) A mixed dendrogram of the collection of 26 U.S. isolates from panel A and only the SA isolates from panel B, which represents the reference collection for generating mixed dendrograms with new collections in order to identify isolates from groups I, II, III, and SA.
FIG. 2.
FIG. 2.
The European collection contains a new clade, group E. (A) A mixed dendrogram generated with the 46 isolates in the European collection (Table 1) and the reference collection illustrated in Fig. 1C, in which groups I, II, III, SA, and the new group E are represented. (B) The European collection alone. (C) The reduced European collection, in which isolates from the same hospital with SABs >0.90 are considered a single isolate. Reference isolates are boxed in gray. Isolates are demarcated in minor European groups e1, e2, and e3 and the minor North American group na2.
FIG. 3.
FIG. 3.
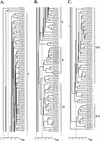
The total North American collection. The mixed dendrogram was generated with the 164 isolates in the North American collection (Table 1), the reference collection in Fig. 1C, and the 12 group E isolates from the European collection. The dendrogram, which includes 212 isolates, has been separated into top (A), middle (B), and bottom (C) portions to fit on one page. Reference isolates are boxed in gray.
FIG. 4.
FIG. 4.
The reduced North American collection. A dendrogram of the reduced North American collection, in which isolates from the same hospital with SABs > 0.90 are considered a single isolate, was generated. The dendrogram, which includes 122 isolates, has been separated into top (A), middle (B), and bottom (C) portions to fit on one page. In addition to groups I, II, III, SA, and E, minor groups na1, na2, and e1 are demarcated.
FIG. 5.
FIG. 5.
South Africa is relatively devoid of group E isolates. (A) A mixed dendrogram generated with 21 isolates from healthy black South Africans attending the Medunsa Clinic and the 12 group E isolates from the European collection. (B) A mixed dendrogram generated with 46 isolates from healthy white South Africans in Pretoria and the 12 group E isolates from the European collection. European reference isolates are boxed in gray. Note that no Medunsa isolate and only one from Pretoria coclusters with European group E isolates.
FIG. 6.
FIG. 6.
DENDRON-generated models of Ca3 fingerprinting patterns of randomly selected isolates from group I (A), group II (B), group III (C), group SA (D), and group E (E). Molecular sizes in kilobases of select bands are presented to the left of the models in panel A. Band widths reflect band intensities. Strains are identified above the patterns.
FIG. 7.
FIG. 7.
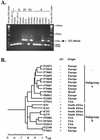
(A) IS1 is present in some group E isolates. IS1 was amplified with IS1-specific primers. The IS1 amplification product was 626 bp. Standards were run in the two outer lanes (1 kb Plus DNA Ladder markers from Invitrogen, Carlsbad, Calif.). Examples of isolates in groups I, II, III, SA, and E are presented. (B) Group E isolates in a dendrogram are scored for the presence of the IS1 intron. Note that only isolates in subgroup b contain IS1 introns.
FIG. 8.
FIG. 8.
(A) A model of node hierarchy observed in the dendrogram generated for all European isolates. Because the nodes demarcating groups I, E, and II were very close, the last node, 4, is encircled with a dashed line. (B) A tree representing the evolution of the five major groups of C. albicans based both on node hierarchy in dendrograms (panel A) and the presence of IS1. This tree is based on the ones developed by Lott et al. (7) and Blignaut et al. (3). The thin branches reflect complete loss of the IS1 intron from a group.

References

    1. Anderson, J., T. Srikantha, B. Morrow, S. H. Miyasaki, T. C. White, N. Agabian, J. Schmid, and D. R. Soll. 1993. Characterization and partial nucleotide sequence of the DNA fingerprinting probe Ca3 of Candida albicans. J. Clin. Microbiol. 31:1472-1480. - PMC - PubMed
    1. Anderson, J. B., C. Wickens, M. Khan, N. Federspiel, T. Jones, and L. M. Kohn. 2001. Infrequent genetic exchange and recombination in the mitochondrial genome of Candida albicans. J. Bacteriol. 183:865-872. - PMC - PubMed
    1. Blignaut, E., C. Pujol, S. Lockhart, S. Joly, and D. R. Soll. 2002. Ca3 fingerprinting of Candida albicans isolates from human immunodeficiency virus-positive and healthy individuals reveals new clade in South Africa. J. Clin. Microbiol. 40:826-836. - PMC - PubMed
    1. Hasenclever, H. F., and W. O. Mitchell. 1961. Antigenic studies of Candida. I. Observations of two antigenic groups in Candida albicans. J. Bacteriol. 82:570-573. - PMC - PubMed
    1. Hasenclever, H. F., and W. O. Mitchell. 1961. Antigenic studies of Candida. III. Comparative pathogenicity of Candida albicans group A, group B, and Candida stellatoidea. J. Bacteriol. 82:578-581. - PMC - PubMed

Publication types