

Evaluation of performance of four genotypic methods for studying the genetic epidemiology of Aspergillus fumigatus isolates
- PMID: 12149346
- PMCID: PMC120644
- DOI: 10.1128/JCM.40.8.2886-2892.2002
Evaluation of performance of four genotypic methods for studying the genetic epidemiology of Aspergillus fumigatus isolates
Abstract
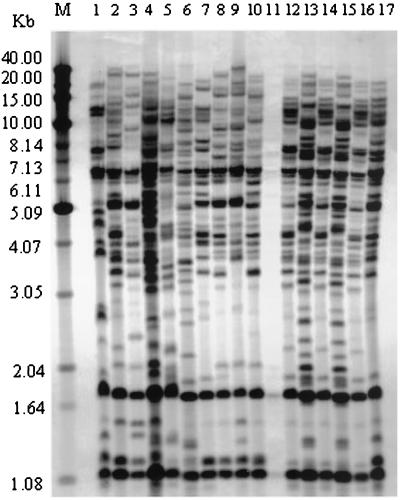
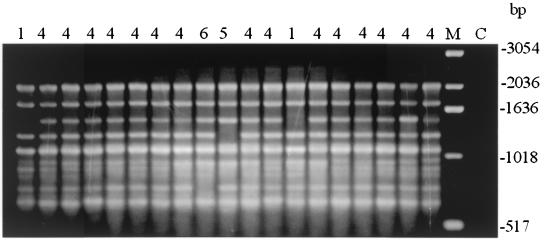
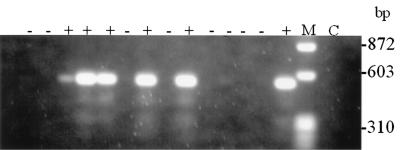
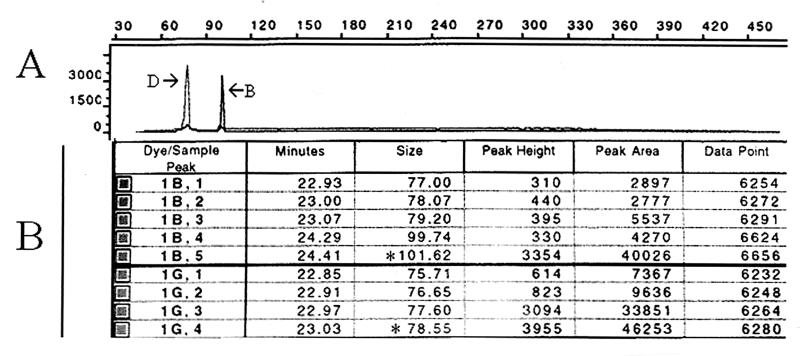
In the present investigation, 49 Aspergillus fumigatus isolates obtained from four nosocomial outbreaks were typed by Afut1 restriction fragment length polymorphism (RFLP) analysis and three PCR-based molecular typing methods: random amplified polymorphic DNA (RAPD) analysis, sequence-specific DNA primer (SSDP) analysis, and polymorphic microsatellite markers (PMM) analysis. The typing methods were evaluated with respect to discriminatory power (D), reproducibility, typeability, ease of use, and ease of interpretation to determine their performance and utility for outbreak and surveillance investigations. Afut1 RFLP analysis detected 40 types. Thirty types were observed by RAPD analysis. PMM analysis detected 39 allelic types, but SSDP analysis detected only 14 types. All four methods demonstrated 100% typeability. PMM and RFLP analyses had comparable high degrees of discriminatory power (D = 0.989 and 0.988, respectively). The discriminatory power of RAPD analysis was slightly lower (D = 0.971), whereas SSDP analysis had the lowest discriminatory power (D = 0.889). Overall, SSDP analysis was the easiest method to interpret and perform. The profiles obtained by PMM analysis were easier to interpret than those obtained by RFLP or RAPD analysis. Bands that differed in staining intensity or that were of low intensity were observed by RAPD analysis, making interpretation more difficult. The reproducibilities with repeated runs of the same DNA preparation or with different DNA preparations of the same strain were high for all the methods. A high degree of genetic variation was observed in the test population, but isolates were not always similarly divided by each method. Interpretation of band profiles requires understanding of the molecular mechanisms responsible for genetic alternations. PMM analysis and Afut1 RFLP analysis, or their combination, appear to provide the best overall discriminatory power, reproducibility, ease of interpretation, and ease of use. This investigation will aid in planning epidemiologic and surveillance studies of A. fumigatus.
Figures
Similar articles
-
Comparison of restriction fragment length polymorphism, microsatellite length polymorphism, and random amplification of polymorphic DNA analyses for fingerprinting Aspergillus fumigatus isolates.J Clin Microbiol. 2001 Jul;39(7):2683-6. doi: 10.1128/JCM.39.7.2683-2686.2001. J Clin Microbiol. 2001. PMID: 11427596 Free PMC article.
-
Molecular typing by random amplification of polymorphic DNA and M13 southern hybridization of related paired isolates of Aspergillus fumigatus.J Clin Microbiol. 1996 Jan;34(1):87-93. doi: 10.1128/jcm.34.1.87-93.1996. J Clin Microbiol. 1996. PMID: 8748280 Free PMC article.
-
Comparison of multiple typing methods for Aspergillus fumigatus.Clin Microbiol Infect. 2009 Jul;15(7):643-50. doi: 10.1111/j.1469-0691.2009.02844.x. Epub 2009 Jun 22. Clin Microbiol Infect. 2009. PMID: 19548925
-
Molecular diagnosis and epidemiology of fungal infections.Med Mycol. 1998;36 Suppl 1:249-57. Med Mycol. 1998. PMID: 9988514 Review.
-
MLST versus microsatellites for typing Aspergillus fumigatus isolates.Med Mycol. 2009;47 Suppl 1:S27-33. doi: 10.1080/13693780802382244. Epub 2009 Feb 28. Med Mycol. 2009. PMID: 19255901 Review.
Cited by
-
Environmental investigations and molecular typing of Aspergillus in a Chinese hospital.Mycopathologia. 2014 Feb;177(1-2):51-7. doi: 10.1007/s11046-013-9697-1. Epub 2014 Jan 18. Mycopathologia. 2014. PMID: 24442359
-
Geoclimatic influences on invasive aspergillosis after hematopoietic stem cell transplantation.Clin Infect Dis. 2010 Jun 15;50(12):1588-97. doi: 10.1086/652761. Clin Infect Dis. 2010. PMID: 20450414 Free PMC article.
-
Characterization of a novel gene for strain typing reveals substructuring of Aspergillus fumigatus across North America.Eukaryot Cell. 2007 Aug;6(8):1392-9. doi: 10.1128/EC.00164-07. Epub 2007 Jun 8. Eukaryot Cell. 2007. PMID: 17557880 Free PMC article.
-
Multi-Locus Microsatellite Typing of Colonising and Invasive Aspergillus fumigatus Isolates from Patients Post Lung Transplantation and with Chronic Lung Disease.J Fungi (Basel). 2024 Jan 24;10(2):95. doi: 10.3390/jof10020095. J Fungi (Basel). 2024. PMID: 38392766 Free PMC article.
-
Aspergillus ustus infections among transplant recipients.Emerg Infect Dis. 2006 Mar;12(3):403-8. doi: 10.3201/eid1203.050670. Emerg Infect Dis. 2006. PMID: 16704776 Free PMC article.
References
-
- Anaissie, E. J., and S. F. Costa. 2001. Nosocomial aspergillosis is waterborne. Clin. Infect. Dis. 33:1546-1548. - PubMed
-
- Bart-Delabesse, E., J. Sarfati, J.-P. Debeaupuis, W. van Leeuwen, A. van Belkum, S. Bretagne, and J.-P. Latgé. 2001. Comparison of restriction fragment length polymorphism, microsatellite length polymorphism, and random amplification of polymorphic DNA analysis for fingerprinting Aspergillus fumigatus isolates. J. Clin. Microbiol. 39:2683-2686. - PMC - PubMed
Publication types
MeSH terms
Substances
LinkOut - more resources
Full Text Sources
