. 2002 Aug 6;99(16):10893-8.
doi: 10.1073/pnas.112276199. Epub 2002 Jul 29.

C-terminal domain phosphatase-like family members (AtCPLs) differentially regulate Arabidopsis thaliana abiotic stress signaling, growth, and development

Affiliations

C-terminal domain phosphatase-like family members (AtCPLs) differentially regulate Arabidopsis thaliana abiotic stress signaling, growth, and development

Hisashi Koiwa et al. Proc Natl Acad Sci U S A. .

Abstract

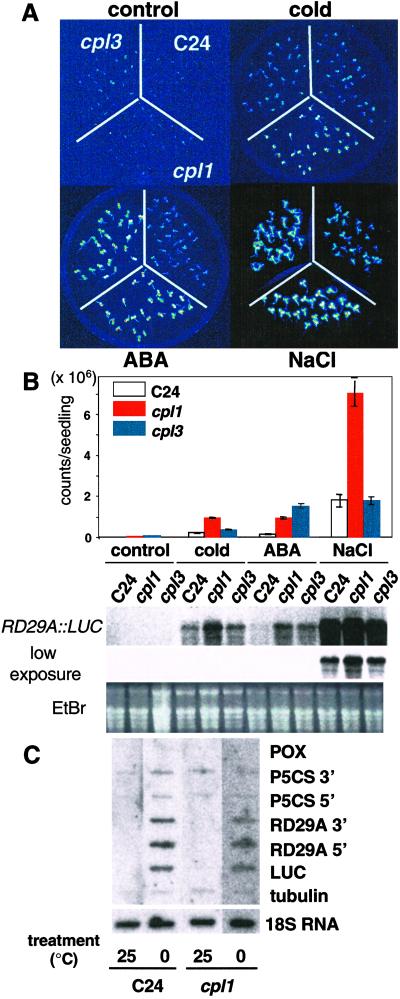
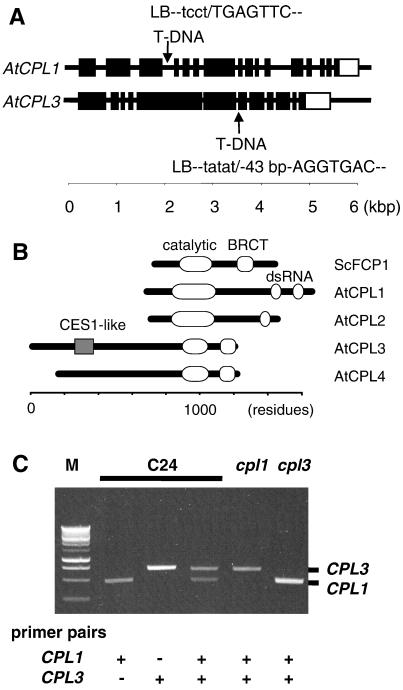
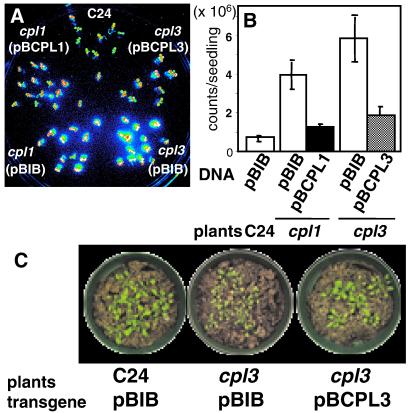
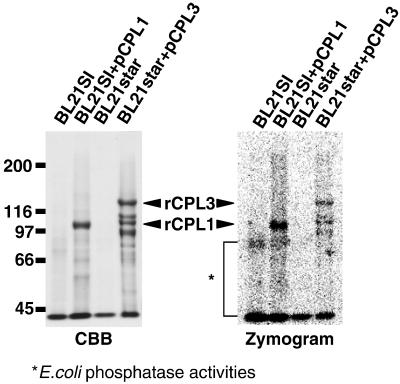
Cold, hyperosmolarity, and abscisic acid (ABA) signaling induce RD29A expression, which is an indicator of the plant stress adaptation response. Two nonallelic Arabidopsis thaliana (ecotype C24) T-DNA insertional mutations, cpl1 and cpl3, were identified based on hyperinduction of RD29A expression that was monitored by using the luciferase (LUC) reporter gene (RD29ALUC) imaging system. Genetic linkage analysis and complementation data established that the recessive cpl1 and cpl3 mutations are caused by T-DNA insertions in AtCPL1 (Arabidopsis C-terminal domain phosphatase-like) and AtCPL3, respectively. Gel assays using recombinant AtCPL1 and AtCPL3 detected innate phosphatase activity like other members of the phylogenetically conserved family that dephosphorylate the C-terminal domain of RNA polymerase II (RNAP II). cpl1 mutation causes RD29ALUC hyperexpression and transcript accumulation in response to cold, ABA, and NaCl treatments, whereas the cpl3 mutation mediates hyperresponsiveness only to ABA. Northern analysis confirmed that LUC transcript accumulation also occurs in response to these stimuli. cpl1 plants accumulate biomass more rapidly and exhibit delayed flowering relative to wild type whereas cpl3 plants grow more slowly and flower earlier than wild-type plants. Hence AtCPL1 and AtCPL3 are negative regulators of stress responsive gene transcription and modulators of growth and development. These results suggest that C-terminal domain phosphatase regulation of RNAP II phosphorylation status is a focal control point of complex processes like plant stress responses and development. AtCPL family members apparently have both unique and overlapping transcriptional regulatory functions that differentiate the signal output that determines the plant response.


Figures

Fig 1.
Fig 1.
A. thaliana cpl1 and cpl3 cause differential RD29A:LUC hyperexpression in response to cold, ABA, and NaCl. (A) Ten-day-old cpl1 and cpl3 T4 and wild-type (C24) seedlings were analyzed after no treatment (control) and after cold (0°C, 2 days), ABA (100 μM, 4 h), and NaCl (300 mM, 4 h) treatment. (B) Luminescence intensity of 8–20 plants per treatment was determined by quantitative analysis of the image recorded with the CCD camera. Error bar represents standard error of the mean. Steady-state transcript level of the LUC transgene was determined after plants were treated as indicated above except for the cold (0°C, 24 h) treatment. The RNA gel blot was hybridized with a digoxygenin-labeled probe corresponding to the entire LUC coding region. (C) Nuclear run-on transcription analysis of cold-treated seedlings. Eight-day-old seedlings growing in vitro were incubated either in 25°C or 0°C for 15 h before isolation of nuclei. Nuclear isolation, run-on reaction, and hybridization were performed as described by Cushman (34). Transcripts hybridized to immobilized probe were detected by Typhoon phosphorimager after 16 h of exposure.
Fig 2.
Fig 2.
cpl1 and cpl3 mutations differentially affect biomass accumulation and flowering time and increase hypocotyl length. (A) Photograph illustrates morphological differences of 5-week-old cpl1, cpl3, and wild type (C24). (Magnification: ×0.2.) (B) Fresh weight of the seventh rosette leaf was determined as an indicator of biomass. (C) Flowering time is expressed as the number of leaves per plant at the onset of anthesis. (D) Hypocotyl length of 5-day-old seedlings was measured. For BD, data are averages of 40–50 plants ± the standard error of the mean.
Fig 3.
Fig 3.
T-DNA insertional mutations (cpl1 and cpl3) abrogate the expression of AtCPL1 and AtCPL3, respectively, which are members of a four-gene family in A. thaliana. (A) Schematic illustration indicates the location of the T-DNA insertions in AtCPL1 and AcCPL3. Exons (▪) were deduced from the cDNA sequence corresponding to AtCPL1 and AtCPL3. The open boxes indicate the 3′ untranslated region. Sequences at the T-DNA left border (lowercase)-genome (uppercase) junctions were determined by thermal asymmetric interlaced-PCR analysis. The cpl3 contains a 43-bp insertion of unknown origin between the T-DNA left border and genomic sequence. (B) Schematic of AtCPLs 1–4 (GenBank accession nos. .1, .1, , and .1, respectively) domain structures compared with the prototypical CTD phosphatase yeast FCP1 (ScFCP1, GenBank accession no. NP014004). Identified are the phosphatase catalytic domain (19), the BRCT domain for proposed RAP74 interaction (19), the CES1 (capping enzyme suppressor) (41)-like region, and the dsRNA-binding domain (43). (C) Transcript abundance in wild-type (C24), cpl1, or cpl3 plants determined by reverse transcriptase–PCR using gene-specific primers for AtCPL1 (CPL1) and AtCPL3 (CPL3) (see Table 1). M, Promega 1-kbp DNA ladder.
Fig 4.
Fig 4.
AtCPL expression functionally complements the hos (high expression of osmotically regulated genes) phenotype of cpl seedlings. Illustrated are wild-type (C24), cpl1, or cpl3 T1 seedlings transformed with vector (pBIB: empty bars in B) or AtCPL1 (pBCPL1: solid bar in B), or AtCPL3 (pBCPL3: hatched bar in B). T1 transformants were transferred to hygromycin-free Murashige and Skoog medium before image acquisition. LUC luminescence image (A) was captured after ABA treatment (100 μM, 3 h) and quantified (B). Bars represent standard error of the mean. Subsequently cpl3 transformants were transferred to soil (C). (Magnifications: ×0.16.)
Fig 5.
Fig 5.
AtCPL are phosphatases. AtCPL1 and AtCPL3 cDNAs were placed under the control of the T7 promoter in the vectors pCPL1 and pCPL3 and expressed in E. coli BL21SI and BL21 star cells to produce rCPL1 and rCPL3, respectively. Protein was isolated from cells without and with pCPL1 or pCPL3 plasmid, normalized based on the culture volume (0.25 ml culture per lane), and then fractionated by SDS/PAGE (6.25% gel). Phosphatase activity was visualized by CCD imaging, after impregnating the gel with CDP star substrate (Zymogram). Protein bands were visualized by Coomassie brilliant blue R-25 (CBB) staining after image acquisition. Innate phosphatase activity of bacterial cells is indicated by *. Zymogram indicates the presence of low Mr degradation product of rCPL3 in bacterial cells.

References

    1. Hasegawa P. M., Bressan, R. A., Zhu, J.-K. & Bohnert, H. J. (2000) Annu. Rev. Plant Physiol. Plant Mol. Biol. 51 463-499. - PubMed
    1. Yamaguchi-Shinozaki K., Koizumi, K., Urao, S. & Shinozaki, K. (1992) Plant Cell Physiol. 33 217-224.
    1. Hajela R. K., Horvath, D. P., Gilmour, S. J. & Thomashow, M. F. (1990) Plant Physiol. 93 1246-1252. - PMC - PubMed
    1. Choi H., Hong, J., Ha, J., Kang, J. & Kim, S. Y. (1999) J. Biol. Chem. 275 1723-1730. - PubMed
    1. Uno Y., Furihara, T., Abe, H., Yoshida, R., Shinozaki, K. & Yamaguchi-Shinozaki, K. (2000) Proc. Natl. Acad. Sci. USA 97 11632-11637. - PMC - PubMed

Publication types

MeSH terms

Associated data