. 2002 Aug 6;99(16):10575-80.
doi: 10.1073/pnas.162136299. Epub 2002 Jul 29.

High-resolution SNP mapping by denaturing HPLC

Affiliations

High-resolution SNP mapping by denaturing HPLC

Knud Nairz et al. Proc Natl Acad Sci U S A. .

Abstract

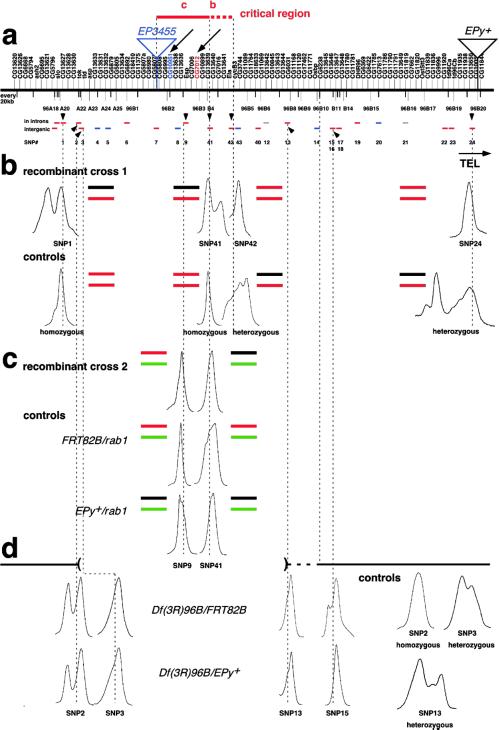
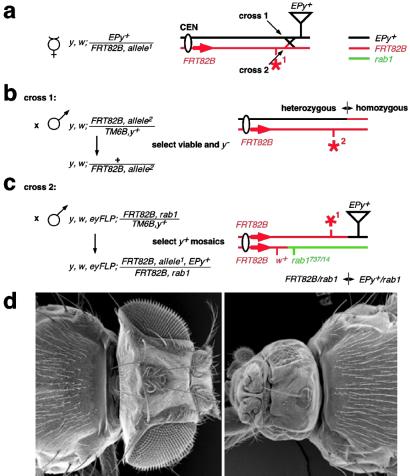
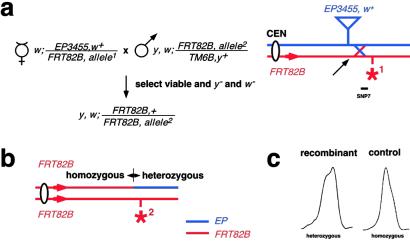
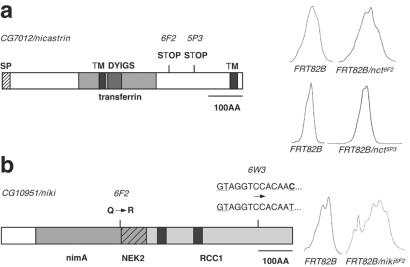
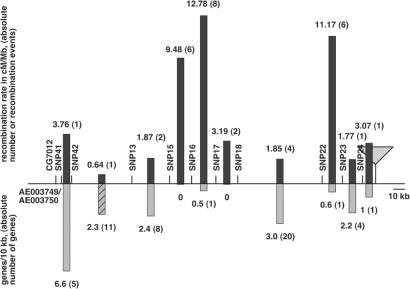
With the availability of complete genome sequences, new rapid and reliable strategies for positional cloning become possible. Single-nucleotide polymorphisms (SNPs) permit the mapping of mutations at a resolution not amenable to classical genetics. Here we describe a SNP mapping procedure that relies on resolving polymorphisms by denaturing HPLC without the necessity of determining the nature of the SNPs. With the example of mapping mutations to the Drosophila nicastrin locus, we discuss the benefits of this method, evaluate the frequency of closely linked and potentially misleading second site mutations, and demonstrate the use of denaturing high-performance liquid chromatography to identify mutations in the candidate genes and to fine-map chromosomal breakpoints. Furthermore, we show that recombination events are not uniformly dispersed over the investigated region but rather occur at hot spots.


Figures

Fig 1.
Fig 1.
The chromosomal organization of cytological region 96A18 to 96B20 and the outcome of the SNP-mapping experiments. (a) The order of the annotated genes from proximal to distal and the insertion sites of the markers used to generate recombinants are indicated. The map is not drawn to scale: thick vertical bars mark every 20 kb, and thin bars refer to the estimated cytological position. Upper horizontal bars symbolize PCR fragments that were amplified from intronic regions; lower bars are products from intergenic regions. Red symbolizes a DHPLC polymorphism, blue a nonmeaningful fragment, and gray a nonamplifiable fragment. SNP marker identifications are given below. Arrowheads point to SNPs shown in b–d that are also aligned with the map by dashed lines. The genes affected by mutagenesis are marked by an arrow and highlighted in red and blue, respectively, and the critical region remaining after SNP mapping is indicated. (b) The chromatographic profile of the closest recombinant from cross 1 is depicted. Note that between SNP41 and SNP42, there is a switch from a heterozygous to a homozygous pattern. The respective profiles derived from the FRT82B parental strain and the heterozygous FRT82B/EPy+ controls are shown below. Bars next to the peaks symbolize the genotype at the site according to the color code from Fig. 2. (c) The closest recombinant from cross 2 switches from a FRT82B/rab1 to a EPy+/rab1 pattern at the SNPs adjacent to the breakpoint. The profiles of control flies and the color-coded genotypes are indicated. (d) The deletion chromosome is polymorphic to FRT82B at SNP15 and exhibits a polymorphism at SNP2 with both FRT82B and EPy+. However, at SNP3 and SNP13 the profile is homozygous against both parental strains indicating loss of heterozygosity. The breakpoints thus place between SNP2 and SNP3 and between SNP13 and SNP15. CG6238/slingshot is situated between the latter SNPs and the mutation complemented by the deficiency thus indicating that the breakpoint is more toward SNP13. Homozygous or heterozygous control profiles are shown and the uncovered region aligned to the map in a falls into the region between the parentheses.
Fig 2.
Fig 2.
The crossing scheme to recover recombinants with a distal, y+ marked, and phenotypically neutral EP element. (a) A recombination event between the mutation (asterisk) on the red FRT82B chromosome and the black EPy+ parental chromosome yields two complementary outcomes (see arrows), which can be selected for by suitable crosses depicted in b and c. By crossing back to a y+-balanced other allele (to avoid effects of second hits), recombinants are distinguished as y flies. Distal to the breakpoint a recombinant is homozygous for the FRT82B background (b). (c) The reciprocal recombinant is discerned by the clonal plus the marker phenotype. To allow for expansion of the clonal tissue, we used an FRT82B chromosome onto which a cell-lethal transposon insertion at the rab1 locus was recombined. At the investigated region, the chromosome thus provides a third strain background (PlacW) that is symbolized by green. Distal to the breakpoint, a recombinant has a EPy+/rab1 and proximal to it a FRT82B/rab1 genotype. (d) A nct5P3 “pinhead” (Right) compared with a wild-type head.
Fig 3.
Fig 3.
(a) Crossing scheme (related to Fig. 2b) and SNP-mapping experiment to establish a left border for the critical region by recombination with a w+-marked EP element. Recombinants will be w and y. (b) A polymorphism between the parental strains EP3455 and FRT82B could be established in the SNP7 fragment directly distal to the insertion site. (b) In a recombinant, SNP7 showed the heterozygotic DHPLC profile (c), indicating that the gene is distal to the transposon.
Fig 4.
Fig 4.
Mutations of two nicastrin alleles and of CG10951/niki. (a) The domain organization of nicastrin and the DHPLC profiles of FRT82B control homozygotes and nct6F2/FRT82 and nct5P3/FRT82 heterozygotes, respectively. SP, signal peptide (hatched); DYIGS, conserved motif (dark gray); transferrin domain in gray. Note the existence of two transmembrane domains (TM, black). STOP, the site of the mutations in the protein sequence. (b) The predicted niki protein and the DHPLC profiles of a FRT82B control homozygote and a niki6F2/FRT82B heterozygote. One EMS-induced polymorphism causes an amino acid exchange in the kinase domain (niki6F2); the other is located in a small intron included in the survey of PCR fragments (niki6W3). nimA and NEK2, domains homologous to the mitotic kinase nimA and its mammalian homologue NEK2 (dark gray and hatched). RCC1, C terminus homologous to the Ran guanine exchange factor RCC1 (gray). Black boxes indicate RCC1 domains.
Fig 5.
Fig 5.
The recombination rate and the distribution of breakpoints between CG7012/nct and the EP element at 96B20 determined for 32 recombinants. The genetic distance between those two markers is 1.0 cM and the physical distance is 0.268 Mb. The map is drawn to scale, the scale bar corresponding to 10 kb. Black bars between two SNPs indicate the ratio of cM per Mb for a given interval. The number of genes per 10 kb is shown by gray bars. Absolute numbers are given in parentheses. One gray bar is hatched because of a gap of unknown length in the reference genome. The regions between SNP15 and SNP18 and SNP22 and SNP23 are meiotic hot spots, which fall into regions of very low gene density.

References

    1. St Johnston D. (2002) Nat. Rev. Genet. 3, 176-188. - PubMed
    1. Berger J., Suzuki, T., Senti, K. A., Stubbs, J., Schaffner, G. & Dickson, B. J. (2001) Nat. Genet. 29, 475-481. - PubMed
    1. Hoskins R. A., Phan, A. C., Naeemuddin, M., Mapa, F. A., Ruddy, D. A., Ryan, J. J., Young, L. M., Wells, T., Kopczynski, C. & Ellis, M. C. (2001) Genome Res. 11, 1100-1113. - PMC - PubMed
    1. Syvanen A. C. (2001) Nat. Rev. Genet. 2, 930-942. - PubMed
    1. Martin S. G., Dobi, K. C. & Johnston, D. S. (2001) Genome Biol. 2, 1-12. - PMC - PubMed

Publication types

LinkOut - more resources