

doi: 10.1073/pnas.162212399.
Epub 2002 Jul 29.
Global analysis of stress-regulated mRNA turnover by using cDNA arrays
Affiliations
- PMID: 12149460
- PMCID: PMC124989
- DOI: 10.1073/pnas.162212399
Item in Clipboard
Global analysis of stress-regulated mRNA turnover by using cDNA arrays
Proc Natl Acad Sci U S A.
.
Abstract
cDNA array technology has proven to be a powerful way to monitor global changes in gene expression patterns. Here, we present an approach that extends the current utility of cDNA arrays to allow the evaluation of the relative roles of transcription and mRNA turnover in governing gene expression on a global basis, compared with current individual gene-by-gene analyses. This method, which involves comparison of large-scale hybridization patterns generated with steady-state mRNA versus newly transcribed (nuclear run-on) RNA, was used to demonstrate the importance of mRNA turnover in regulating gene expression following several conditions of stress.
Figures
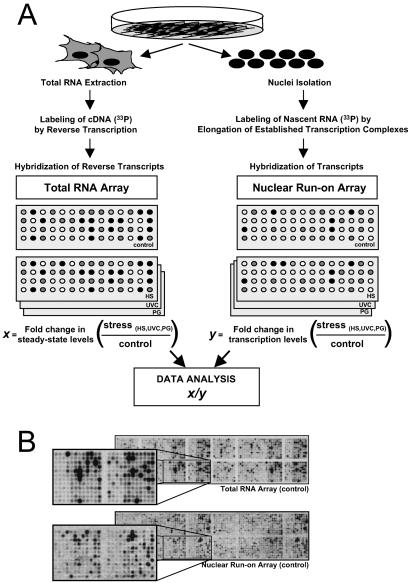
Strategy to study stress-triggered alterations in mRNA turnover by using cDNA arrays. (A) Following treatment of H1299 cells with either UVC (20 J/m2), HS (43°C, 2 h), or PG (36 μM), two sets of radiolabeled probes were prepared: total RNA (Left), isolated 8 h after stimulation, was used to prepare radiolabeled cDNA through reverse transcription in the presence of [α-33P]dCTP; and newly transcribed RNA (Right), prepared 3 h after stimulation, was radiolabeled in a nuclear run-on reaction in the presence of [α-33P]UTP. x, fold difference in signal intensity (stress-treated relative to untreated) for a given gene on total RNA arrays; y, fold difference in signal intensity (stress-treated relative to untreated) for a given gene on nuclear run-on arrays. (B) Representative cDNA arrays to illustrate the hybridization signals corresponding to either steady-state RNA levels (total RNA array) or newly transcribed RNA (nuclear run-on array), in untreated populations. Correlation coefficients serving to evaluate the internal reproducibility of the signals on total RNA arrays and nuclear run-on arrays were 0.99 in each case (not shown). The array (ref. ; www.grc.nia.nih.gov/branches/rrb/dna/array.htm ) includes cDNA segments typically comprising the 3′ UTR and coding region. cDNA fragments range from 500 to 2,000 bp.
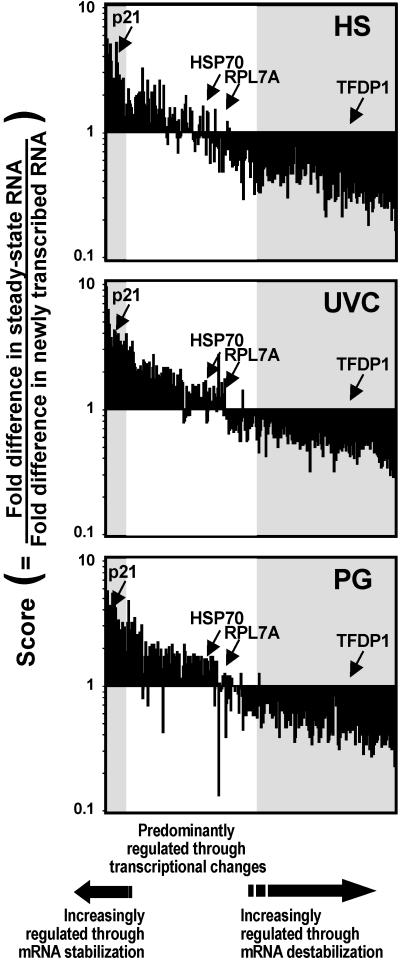
Global assessment of stress-triggered alterations in mRNA turnover relative to stress-triggered alterations in gene transcription. Alignment of the stress-regulated 311 genes according to their score values, beginning with the genes with highest average scores on the left, then genes with progressively lower average scores toward the right. Shaded regions on the left highlight genes with scores >2 (encoding stress-stabilized mRNAs); shaded regions on the right highlight genes with scores <0.6 (encoding stress-destabilized mRNAs). Middle, white regions encompass genes with scores close to 1, whose stress-regulated expression is primarily modulated by changes in transcription. Representative genes from Groups II–V are shown.

Validation of stress-triggered changes in steady-state and nascent mRNA levels. H1299 cells, treated as described in Fig. 1, were collected at various time intervals for either Northern blot (Left) or nuclear run-on (Right) analyses. Control hybridizations to detect 18S rRNA, β-actin, and glyceraldehyde-3-phosphate dehydrogenase (GAPDH) were performed to monitor the evenness of loading and transfer of Northern blot samples, whereas control hybridizations to dot-blotted β-actin, GAPDH, and insert-less plasmid pUC18 served to assess the equality and specificity of the nuclear run-on hybridizations.
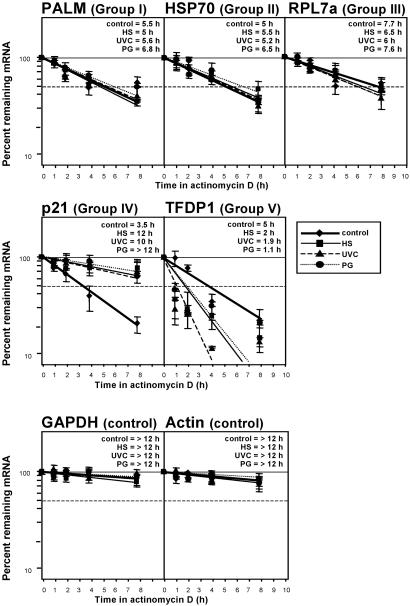
Validation of stress-regulated changes in mRNA half-life. Following treatment of H1299 cells as described in Fig. 1, actinomycin D (2 μg/ml) was added and total RNA collected at various time intervals. Half-lives of mRNAs encoding genes of interest from each gene expression group (Table 1) were assessed after measuring Northern blot signals, normalizing them to 18S rRNA signals, and plotting them on a logarithmic scale. mRNA half-life is defined as the time period required to achieve a reduction of 50% (dashed horizontal line) of transcript. Data represent the means ± SEM of four independent experiments.
Comment in
-
Life after transcription--revisiting the fate of messenger RNA.Trends Genet. 2003 Mar;19(3):113-5. doi: 10.1016/S0168-9525(02)00047-1. Trends Genet. 2003. PMID: 12615000
References
MeSH terms
Substances
LinkOut - more resources
Full Text Sources
Other Literature Sources
