. 2002 Aug 6;99(16):10506-9.
doi: 10.1073/pnas.162216899. Epub 2002 Jul 29.

Supply-demand balance and metabolic scaling

Affiliations

Supply-demand balance and metabolic scaling

Jayanth R Banavar et al. Proc Natl Acad Sci U S A. .

Abstract

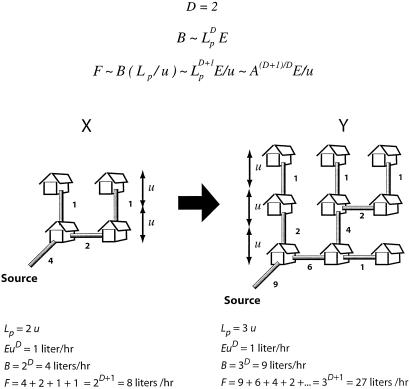
It is widely accepted that metabolic rates scale across species approximately as the 3/4 power of mass in most if not all groups of organisms. Metabolic demand per unit mass thus decreases as body mass increases. Metabolic rates reflect both the ability of the organism's transport system to deliver metabolites to the tissues and the rate at which the tissues use them. We show that the ubiquitous 3/4 power law for interspecific metabolic scaling arises from simple, general geometric properties of transportation networks constrained to function in biological organisms. The 3/4 exponent and other observed scaling relationships follow when mass-specific metabolic demands match the changing delivery capacities of the network at different body sizes. Deviation from the 3/4 exponent suggests either inefficiency or compensating physiological mechanisms. Our conclusions are based on general arguments incorporating the minimum of biological detail and should therefore apply to the widest range of organisms.


Figures

Fig 1.
Fig 1.
Example of general scaling properties of directed transportation networks. The figure illustrates in a schematic way the mathematical theorem proven in ref. , a nonbiological case in which the volume of the transport network is not constrained to scale isometrically with the volume that it is supplying (see text). This theorem can be directly applied to the study of network allometry (14, 19). Symbols are as defined in the text. Our example network consists of water (“blood”) being transported from a source (“the heart”) at a constant rate to each house of a space-filling neighborhood of identical houses (“all parts of the body”). For ease of illustration, we have represented everything as if it occurred in two dimensions (D = 2), but the argument and theorem apply in the same way to the three-dimensional case. Consider two neighborhoods of different size (X and Y, where the number of houses is proportional to their respective areas, A). The amount of water each pipe must carry per unit time is indicated adjacent to the respective pipe in the figure. The total flow rate of water (F) in a network must scale as A(D+1)/D to supply each house at a constant rate independent of the size of the neighborhood. Thus the quantity of the circulating water increases superlinearly with neighborhood size. A more detailed explanation is as follows: Neighborhoods X and Y are of different sizes (characterized by different physical lengths, Lp). To make units explicit, we standardize our length scale to be in units of u, a length based on the size of a typical house and its immediate environs. The area (or volume) associated with a house is uD. The amount of water leaving the source per unit time and thence arriving at the houses constitutes the total “metabolic rate” (B) of each neighborhood. All of the houses are identical, and in each neighborhood they consume the same amount of water per unit time per house (EuD, where E is the rate of water use per unit area). (Note that in the biological case, E would depend on the size of the “neighborhood.”) The sum of the individual flow rates (the amount of water circulating in all the pipes of a neighborhood per unit time), F, is proportional to B but with a proportionality constant equal to the mean distance from the source to all the houses, measured along the transportation route. This additional factor arises because the transportation system contains water bound to all houses, and each house places an additional requirement on F of an amount proportional to its distance from the source. For example, to satisfy the requirement that a house three units (3 u) from the source is supplied by an amount EuD of water (over every unit time interval), it is necessary to ensure that there is a total amount 3 EuD of water in the pipes on the way to the house that will not be used by any intervening house. The most efficient transportation system, characterized by the smallest F, is one in which this mean distance from the source to the houses is as small as possible. This happens when the transportation is directed away from the source toward the houses. In a D dimensional space, B scales as Lformula imageE, where Lp is the physical length of the neighborhood, and the number of houses scales as (Lp/u)D. Our theorem (14, 15) asserts that because the additional factor corresponding to the mean distance from the houses to the source must itself scale at least as Lp/u, F must scale at least as BLp/u. This means that if A = Lformula image is the conventional “size” of a neighborhood (its area if D = 2 or its volume if D = 3), then formula image and the total flow rate per unit area in the system thus increases with neighborhood size; this can be readily confirmed from the figure. (An even simpler example is the case of a one-dimensional network of length Lp, F is proportional to 1+2+3+4+ ⋯ +Lp. This sum scales as Lformula image in accord with the above equation.) It can be proven exactly that this result is independent of whether or not one has an underlying network, as long as the flow is “radially” outward from the source to the sinks (17, 18). Furthermore, the result is the same whether or not the houses are terminal units and whether or not they lie on a regular network (as shown in Fig. 1). Also, the scaling behavior holds in the large length scale limit independently of whether the source is at the periphery of the neighborhood, as shown in the figure, or whether it is somewhere within the neighborhood.

Comment in

Similar articles

Cited by

References

    1. McMahon T. A. & Bonner, J. T., (1983) On Size and Life (Freeman, New York).
    1. Bonner J. T., (1983) The Evolution of Complexity by Means of Natural Selection (Princeton Univ. Press, Princeton).
    1. Peters R. H., (1983) The Ecological Implications of Body Size (Cambridge Univ. Press, Cambridge, U.K.).
    1. Schmidt-Nielsen K., (1984) Scaling: Why Is Animal Size So Important? (Cambridge Univ. Press, Cambridge, U.K.).
    1. Calder W. A., (1984) Size, Function, and Life History (Harvard Univ. Press, Cambridge, MA).

Publication types

LinkOut - more resources