. 2002 Aug 1;22(15):6336-46.
doi: 10.1523/JNEUROSCI.22-15-06336.2002.

Multimodal quantal release at individual hippocampal synapses: evidence for no lateral inhibition

Affiliations

Multimodal quantal release at individual hippocampal synapses: evidence for no lateral inhibition

Alessandra Abenavoli et al. J Neurosci. .

Abstract

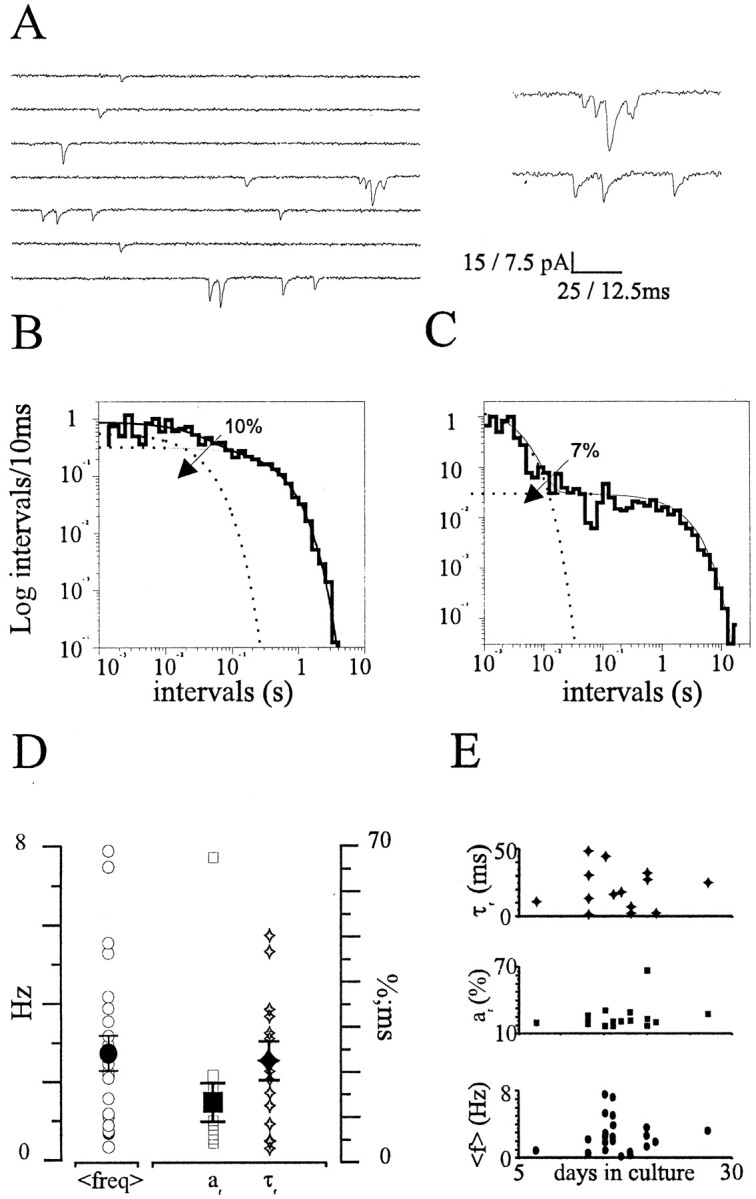
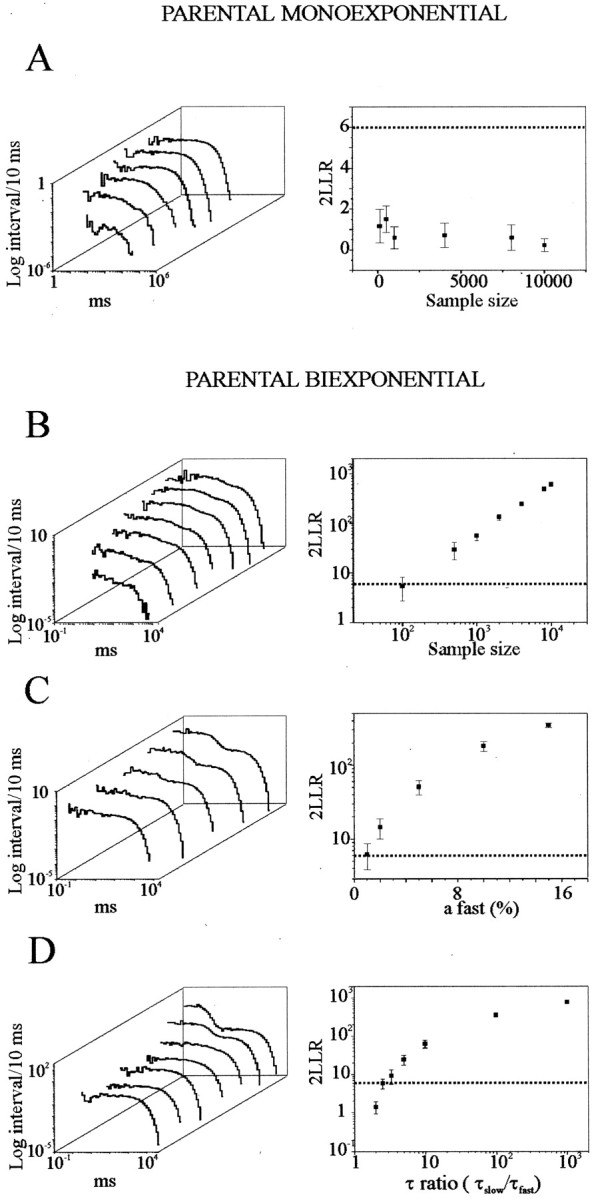
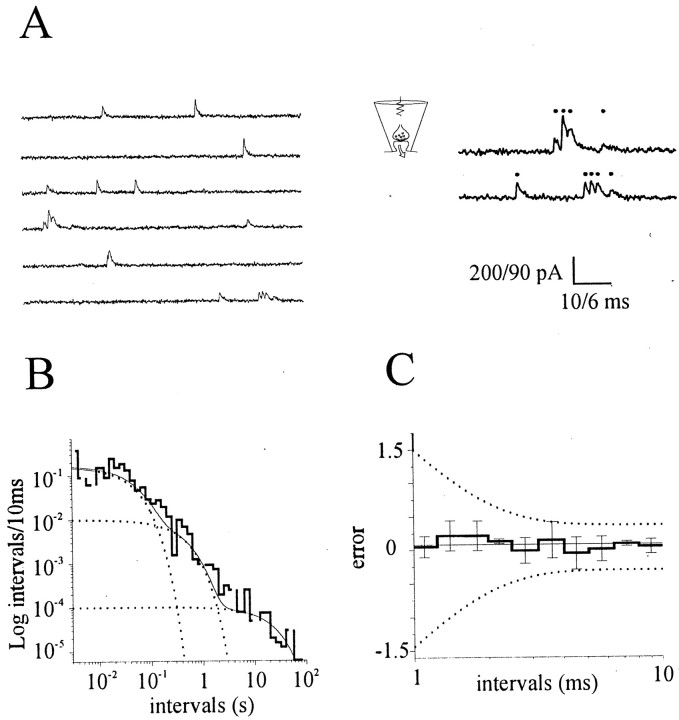
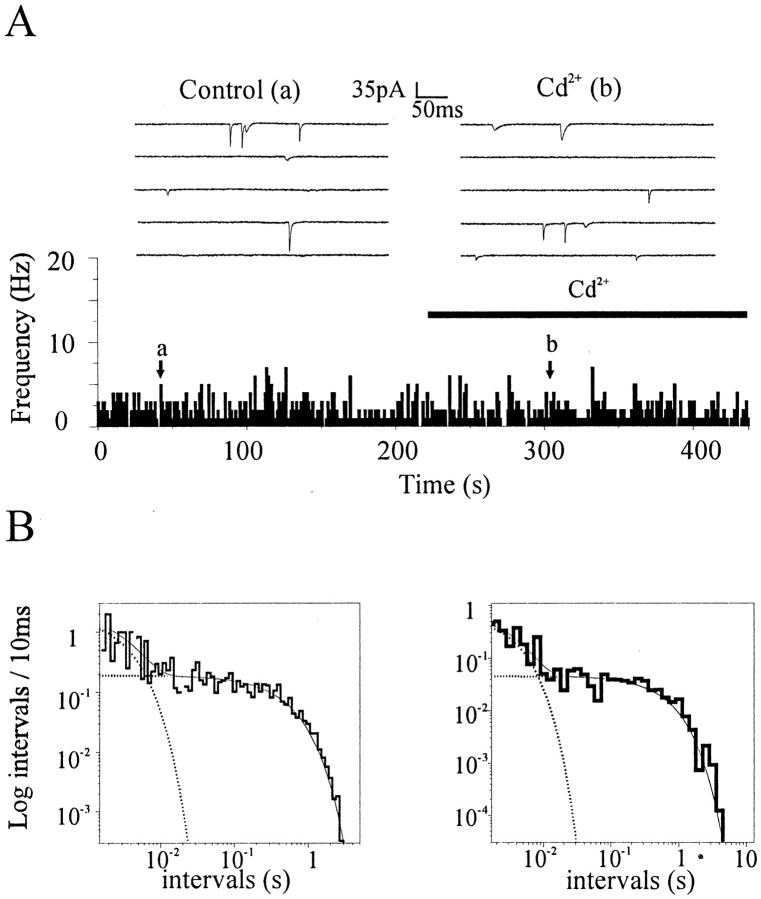
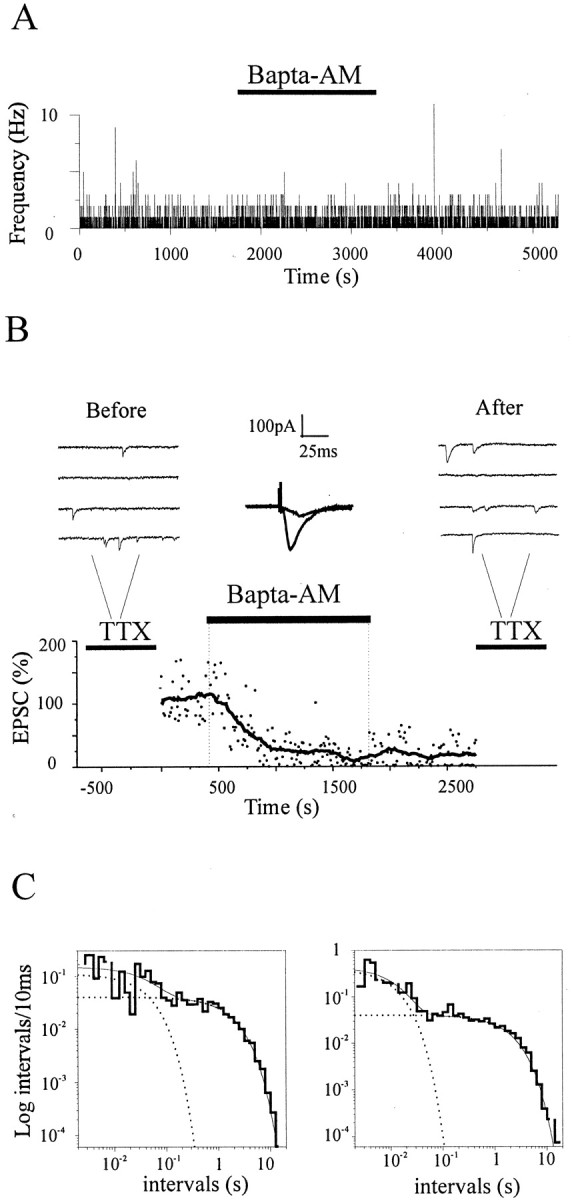
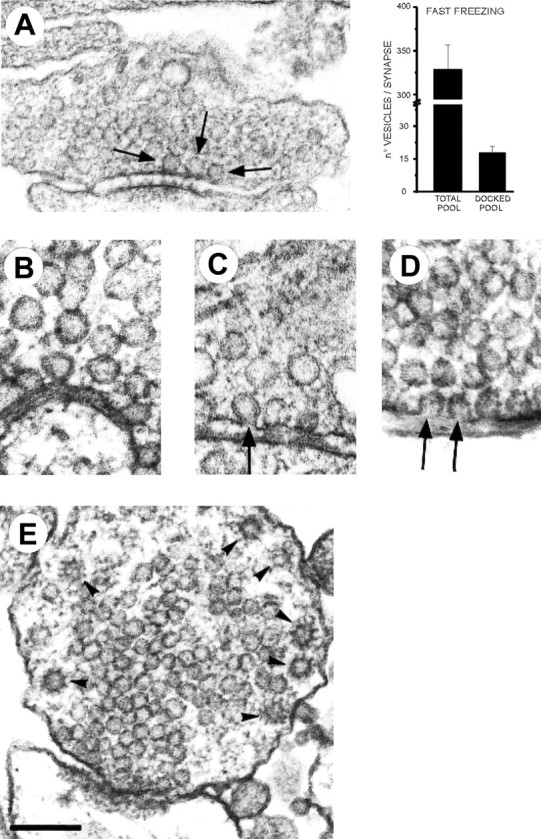
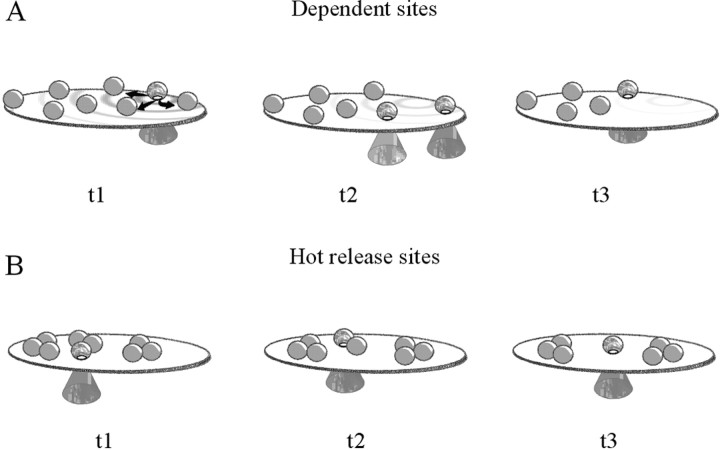
Most CNS synapses investigated thus far contain a large number of vesicles docked at the active zone, possibly forming individual release sites. At the present time, it is unclear whether these vesicles can be discharged independently of one another. To investigate this problem, we recorded miniature excitatory currents by whole-cell and single-synapse recordings from CA3-CA1 hippocampal neurons and analyzed their stochastic properties. In addition, spontaneous release was investigated by ultrastructural analysis of quickly frozen synapses, revealing vesicle intermediates in docking and spontaneous fusion states. In these experiments, no signs of inhibitory interactions between quanta could be detected up to 1 msec from the previous discharge. This suggests that exocytosis at one site does not per se inhibit vesicular fusion at neighboring sites. At longer intervals, the output of quanta diverged from a random memoryless Poisson process because of the presence of a bursting component. The latter, which could not be accounted for by random coincidences, was independent of Ca2+ elevations in the cytosol, whether from Ca2+ flux through the plasma membrane or release from internal stores. Results of these experiments, together with the observation of spontaneous pairs of omega profiles at the active zone, suggest that multimodal release is produced by an enduring activation of an integrated cluster of release sites.


Figures

Fig. 1.
Fig. 1.
Occurrence of spontaneous minis in WC recordings and interval analysis. A, A WC current recording of minis from a hippocampal neuron. Short trains of minis can be seen consistently in these conditions (see also expanded traces on theright; holding potential = −60 mV). B, C, Log-binned mini-interval distributions from two representative WC experiments (B, τfast = 30.8 msec, τslow = 0.47 sec; C, τfast = 3.07 msec, τslow = 2.20 sec). D, Summary data for the mean mini frequency (freq), area (af), and time constant (τf) of the short-interval component (rangeaf = 3–66%, mean 12 ± 4%; range τf = 1.56–48.64 msec, mean 20.37 ± 4.07 msec). E, No correlation between τfast, af, and mean frequency (f) with the developmental stage of the hippocampal cultures (p > 0.1).
Fig. 2.
Fig. 2.
Resolution limits of interval analysis.A–D, Simulated log-binned distributions (left) and log-likelihood ratio (LLR) scores (right) obtained by Monte Carlo sampling from monoexponential and biexponential distributions while varying sample sizes (A, B), contribution from the short-interval component (C), and τ ratios (D).Right, Each point is the average of four different simulations (mean ± SD). Dotted lines represent the a = 0.05 level of significance to distinguish between the monoexponential versus the biexponential hypothesis. This resolution limit corresponds to: a sample size of n= 156 (B), area of the fast componentafast = 1.2% (C), and τ ratio = 2.98 (D). Parameters used in the above simulations are: A, t = 1 sec,n = 100, 500, 1000, 4000, 8000, and 10,000;B, τfast = 50 msec, τslow = 1 sec, afast= 15%, n = 100, 500, 1000, 2000, 4000, 8000, and 10,000; C, τfast = 50 msec, τslow = 1 sec, n = 2000,afast = 1, 2, 5, 10, and 15%;D, τslow = 1 sec,n = 2000, afast = 15%, τfast = 10, 50, 100, 200, 300, 400, and 500 msec.
Fig. 3.
Fig. 3.
Occurrence of spontaneous minis at individual synapses. A, Minis recorded from one hippocampal synapse with synaptic loose patch. Notice how trains of minis, each one marked by a dot, can occur in short intervals of time (right, expanded traces). B, Log-binned histogram of mini-intervals from the same single-bouton recording experiment as in A. Multiple exponentials were always required for best fit of interval distributions, indicating a divergence from simple Poisson statistics. The histogram presented was best fitted by the sum (solid line) of three decaying exponentials (dotted lines) (p < 10−4, τfast = 42.18 msec, τmedium = 402.24 msec, τslow = 21.54 sec; relative areas, 51, 33, and 16%; n = 165 events). C, Ensemble plot from n = 6 single-synapse experiments illustrating the lack of inhibition at very short intervals. Each bin plots the mean ± SD of the difference between the bin entry and the fit value (error bars). The dotted lines plot the 5% confidence limits for a single-exponential distribution obtained with Monte Carlo random sampling methods (n = 11).
Fig. 4.
Fig. 4.
Cadmium does not reduce mini frequency and the shape of interval distributions. A, Frequency plot of minis before and during the application of Cd2+ (100 mm). Notice how Cd2+ does not significantly reduce mini frequency. B, Log-binned histograms of mini-intervals from the same experiment as presented inA, before (left) and during (right) the application of Cd2+. In both conditions, histograms were better fitted by two exponential components (τcontrol, 3.21 msec and 0.49 sec; τcadmium, 2.92 msec and 0.64 sec;afast-control = 4%,afast-cadmium = 8%;p < 0.05; n = 936 and 321 events).
Fig. 5.
Fig. 5.
Loading nerve terminals with BAPTA does not affect mini frequency and interval distributions. A, Plot of mini frequency before, during, and after the application of BAPTA-AM (25 mm) to illustrate that BAPTA does not reduce mini frequency (0.48 ± 0.88 Hz before, 0.48 ± 0.76 Hz after; mean ± SD). B, Effects of BAPTA loading (BAPTA-AM, 25 mm) on evoked and spontaneous synaptic responses. Evoked responses were almost completely suppressed by BAPTA (t1/2 ∼4 min), whereas mini frequency was left unaltered. Top, Consecutive traces with minis in the presence of TTX before (left) and after (right) BAPTA loading. Center, the superimposition of evoked responses 1 min before and 10 min after the beginning of BAPTA perfusion (averages of 5 consecutive traces).C, Log-binned histograms of mini-intervals before (left) and after (right) the application of BAPTA-AM. BAPTA did not abolish the fast component, and in both conditions, histograms were better fitted by the sum of two exponentials (p < 0.05; τfast-control = 48.64 msec, τslow-control = 2.18 sec,afast-control = 6%; τfast-BAPTA = 12.8 msec, τslow-BAPTA = 2.1 sec,afast-BAPTA = 5%;n = 877, 865 events).
Fig. 6.
Fig. 6.
Spontaneous fusions seen with fast freezing of hippocampal synapses. A, A quick-freezing image of a hippocampal synapse. Arrows indicate the presence of three docked vesicles at the active zone. Right, Quantitative data from morphological analysis of the total recycling pool and docked pool (n = 23 serially reconstructed synapses). B, C, Spontaneous omega figures. Notice the occurrence of omega figures with narrow (B) or more widely open (C) fusion necks. Spontaneous fusions were always topographically restricted to the active zone.D, Examples of two omega figures simultaneously present at the same active zone. These always occurred in close spatial proximity. E, Example of a synapse with multiple coated vesicles. These vesicular structures were always localized at the periphery of presynaptic terminals. Scale bars: A, 0.2 μm;B–D, 0.1 μm; E, 0.15 μm.
Fig. 7.
Fig. 7.
Different scenarios for bursting of quanta at hippocampal synapses. A, Quanta are released at distant sites through diffusion of a small intracellular molecule. According to this scenario, releases would display some degree of dependency in their occurrence because they were triggered by this diffusing small signal. B, According to this model, a group of neighboring docked vesicles, tightly associated through some large molecular component (macrosite), gets absorbed in a hot or bursting mode and quickly discharges some or all of its vesicles.

References

    1. Adler EM, Augustine GJ, Duffy SN, Charlton MP. Alien intracellular Ca2+ chelators attenuate neurotransmitter release at the squid giant synapse. J Neurosci. 1991;11:1496–1507. - PMC - PubMed
    1. Antonova I, Arancio O, Trillat AC, Wang HG, Zablow L, Udo H, Kandel ER, Hawkins RD. Rapid increase in clusters of presynaptic proteins at onset of long-lasting potentiation. Science. 2001;294:1547–1550. - PubMed
    1. Auger C, Marty A. A heterogeneity of functional synaptic parameters among single release sites. Neuron. 1997;19:139–150. - PubMed
    1. Auger C, Kondo S, Marty A. Multivesicular release at single functional synaptic sites in cerebellar stellate and basket cells. J Neurosci. 1998;18:4532–4547. - PMC - PubMed
    1. Augustine GJ, Charlton MP, Smith SJ. Ca2+ action in synaptic transmitter release. Annu Rev Neurosci. 1987;10:633–693. - PubMed

Publication types

MeSH terms

LinkOut - more resources