

Mutations in high-voltage-activated calcium channel genes stimulate low-voltage-activated currents in mouse thalamic relay neurons
- PMID: 12151514
- PMCID: PMC6758149
- DOI: 10.1523/JNEUROSCI.22-15-06362.2002
Mutations in high-voltage-activated calcium channel genes stimulate low-voltage-activated currents in mouse thalamic relay neurons
Abstract
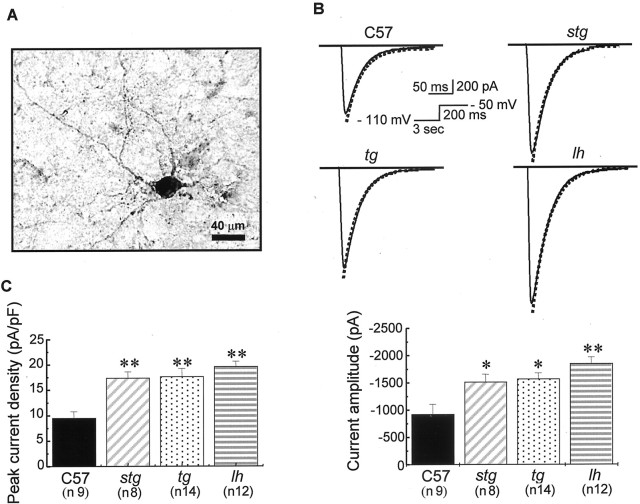
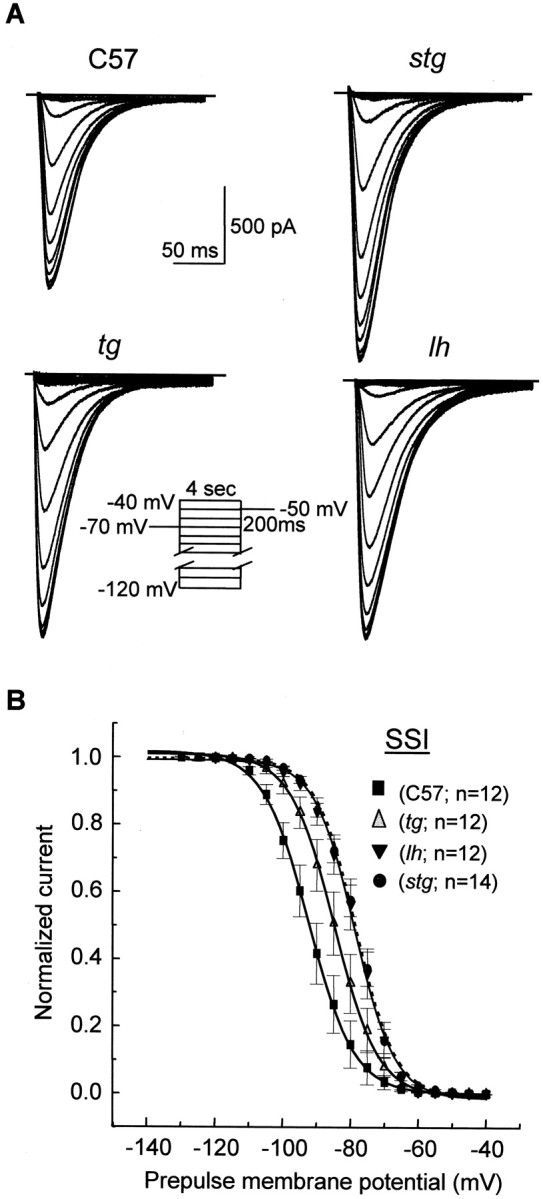
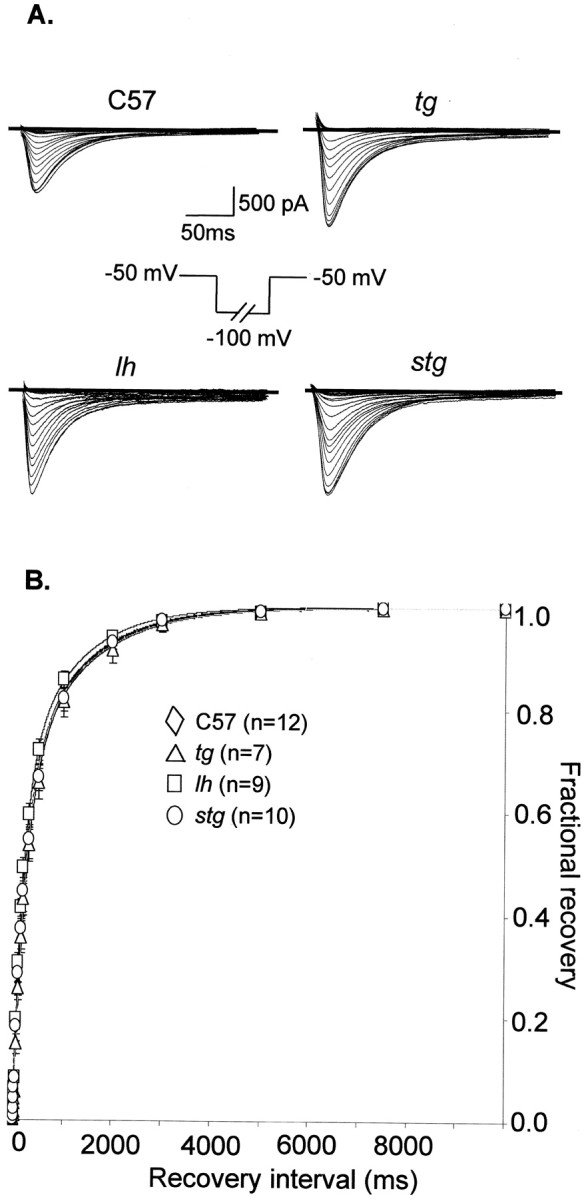
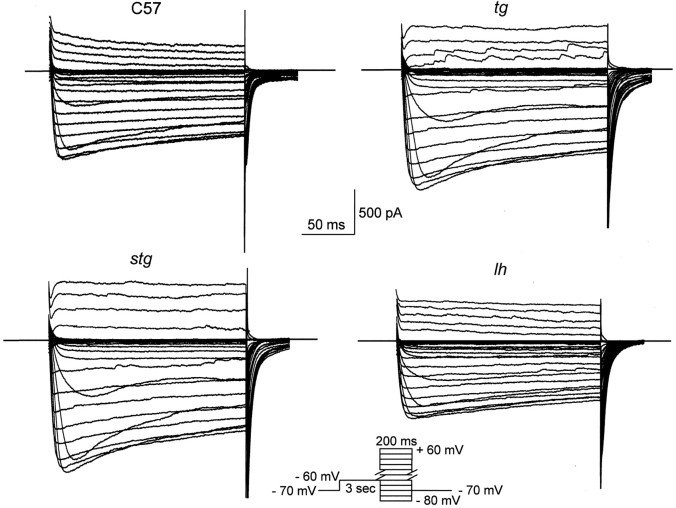
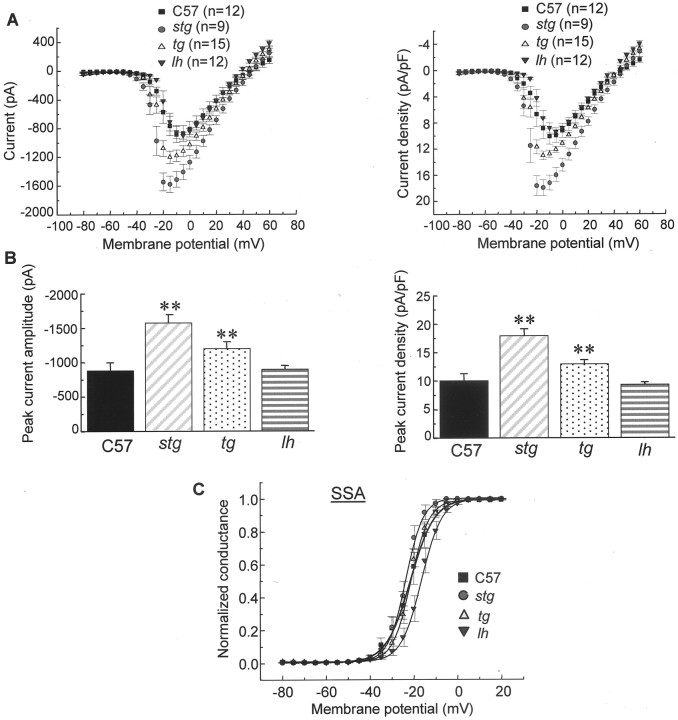
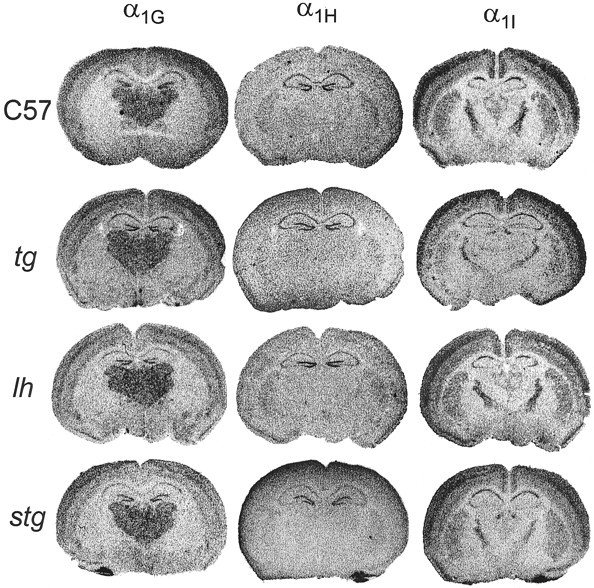
Ca2+ currents, especially those activated at low voltages (LVA), influence burst generation in thalamocortical circuitry and enhance the abnormal rhythmicity associated with absence epilepsy. Mutations in several genes for high-voltage-activated (HVA) Ca2+ channel subunits are linked to spike-wave seizure phenotypes in mice; however, none of these mutations are predicted to increase intrinsic membrane excitability or directly enhance LVA currents. We examined biophysical properties of both LVA and HVA Ca2+ currents in thalamic cells of tottering (tg; Cav2.1/alpha1A subunit), lethargic (lh; beta4 subunit), and stargazer (stg; gamma2 subunit) brain slices. We observed 46, 51, and 45% increases in peak current densities of LVA Ca2+ currents evoked at -50 mV from -110 mV in tg, lh, and stg mice, respectively, compared with wild type. The half-maximal voltages for steady-state inactivation of LVA currents were shifted in a depolarized direction by 7.5-13.5 mV in all three mutants, although no alterations in the time-constant for recovery from inactivation of LVA currents were found. HVA peak current densities in tg and stg were increased by 22 and 45%, respectively, and a 5 mV depolarizing shift of the activation curve was observed in lh. Despite elevated LVA amplitudes, no alterations in mRNA expression of the genes mediating T-type subunits, Cav3.1/alpha1G, Cav3.2/alpha1H, or Cav3.3/alpha1I, were detected in the three mutants. Our data demonstrate that mutation of Cav2.1 or regulatory subunit genes increases intrinsic membrane excitability in thalamic neurons by potentiating LVA Ca2+ currents. These alterations increase the probability for abnormal thalamocortical synchronization and absence epilepsy in tg, lh, and stg mice.
Figures
Similar articles
-
Role of the alpha1G T-type calcium channel in spontaneous absence seizures in mutant mice.J Neurosci. 2004 Jun 2;24(22):5249-57. doi: 10.1523/JNEUROSCI.5546-03.2004. J Neurosci. 2004. PMID: 15175395 Free PMC article.
-
Elevated thalamic low-voltage-activated currents precede the onset of absence epilepsy in the SNAP25-deficient mouse mutant coloboma.J Neurosci. 2004 Jun 2;24(22):5239-48. doi: 10.1523/JNEUROSCI.0992-04.2004. J Neurosci. 2004. PMID: 15175394 Free PMC article.
-
Modulation by extracellular pH of low- and high-voltage-activated calcium currents of rat thalamic relay neurons.J Neurophysiol. 2001 Mar;85(3):1051-8. doi: 10.1152/jn.2001.85.3.1051. J Neurophysiol. 2001. PMID: 11247975
-
Role of voltage-gated calcium channels in epilepsy.Pflugers Arch. 2010 Jul;460(2):395-403. doi: 10.1007/s00424-009-0772-x. Epub 2009 Dec 20. Pflugers Arch. 2010. PMID: 20091047 Free PMC article. Review.
-
Single gene defects in mice: the role of voltage-dependent calcium channels in absence models.Epilepsy Res. 1999 Sep;36(2-3):111-22. doi: 10.1016/s0920-1211(99)00045-5. Epilepsy Res. 1999. PMID: 10515159 Review.
Cited by
-
Transmembrane AMPAR regulatory protein γ-2 is required for the modulation of GABA release by presynaptic AMPARs.J Neurosci. 2015 Mar 11;35(10):4203-14. doi: 10.1523/JNEUROSCI.4075-14.2015. J Neurosci. 2015. PMID: 25762667 Free PMC article.
-
A functional AMPA receptor-calcium channel complex in the postsynaptic membrane.Proc Natl Acad Sci U S A. 2006 Apr 4;103(14):5561-6. doi: 10.1073/pnas.0601289103. Epub 2006 Mar 27. Proc Natl Acad Sci U S A. 2006. PMID: 16567654 Free PMC article.
-
SNAP-25 in neuropsychiatric disorders.Ann N Y Acad Sci. 2009 Jan;1152:93-9. doi: 10.1111/j.1749-6632.2008.03995.x. Ann N Y Acad Sci. 2009. PMID: 19161380 Free PMC article.
-
The 'window' T-type calcium current in brain dynamics of different behavioural states.J Physiol. 2005 Jan 1;562(Pt 1):121-9. doi: 10.1113/jphysiol.2004.076273. Epub 2004 Oct 21. J Physiol. 2005. PMID: 15498803 Free PMC article. Review.
-
Role of the alpha1G T-type calcium channel in spontaneous absence seizures in mutant mice.J Neurosci. 2004 Jun 2;24(22):5249-57. doi: 10.1523/JNEUROSCI.5546-03.2004. J Neurosci. 2004. PMID: 15175395 Free PMC article.
References
-
- Ahlijanian MK, Westenbroek RE, Catterall WA. Subunit structure and localization of dihydropyridine-sensitive calcium channels in mammalian brain, spinal cord, and retina. Neuron. 1990;6:819–832. - PubMed
-
- Brice NL, Berrow NS, Campbell V, Page KM, Brickley K, Tedder I, Dolphin AC. Importance of the different beta subunits in the membrane expression of the alpha1A and alpha2 calcium channel subunits: studies using a depolarization-sensitive alpha1A antibody. Eur J Neurosci. 1997;9:749–759. - PubMed
-
- Burgess DL, Jones JM, Meisler MH, Noebels JL. Mutation of the Ca2+-channel β subunit gene Cchb4 is associated with ataxia and seizures in the lethargic (lh) mouse. Cell. 1997;88:385–392. - PubMed
-
- Burgess DL, Biddlecome GH, McDonough SI, Diaz ME, Zilinski CA, Bean BP, Campbell KP, Noebels JL. β subunit reshuffling modifies N- and P/Q type Ca2+ channel subunit compositions in lethargic mouse brain. Mol Cell Neurosci. 1999;13:293–311. - PubMed
-
- Burgess DL, Gefrides LA, Foreman PJ, Noebels JL. A cluster of three novel Ca2+ channel gamma subunit genes on chromosome 19q13.4: evolution and expression profile of the gamma subunit gene family. Genomics. 2001;71:339–350. - PubMed
Publication types
MeSH terms
Substances
Grants and funding
LinkOut - more resources
Full Text Sources
Other Literature Sources
Molecular Biology Databases
Miscellaneous