. 2002 Aug 1;22(15):6380-7.
doi: 10.1523/JNEUROSCI.22-15-06380.2002.

Cholecystokinin tunes firing of an electrically distinct subset of arcuate nucleus neurons by activating A-Type potassium channels

Affiliations

Cholecystokinin tunes firing of an electrically distinct subset of arcuate nucleus neurons by activating A-Type potassium channels

Denis Burdakov et al. J Neurosci. .

Abstract

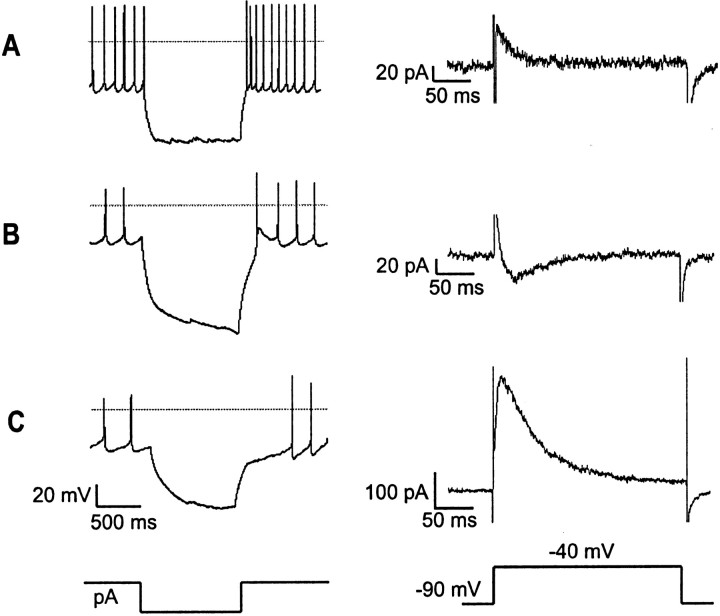
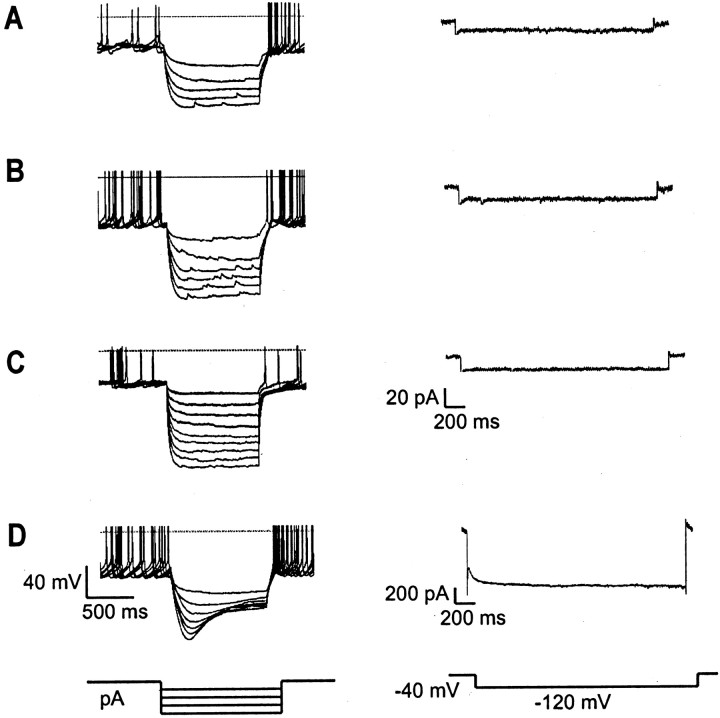
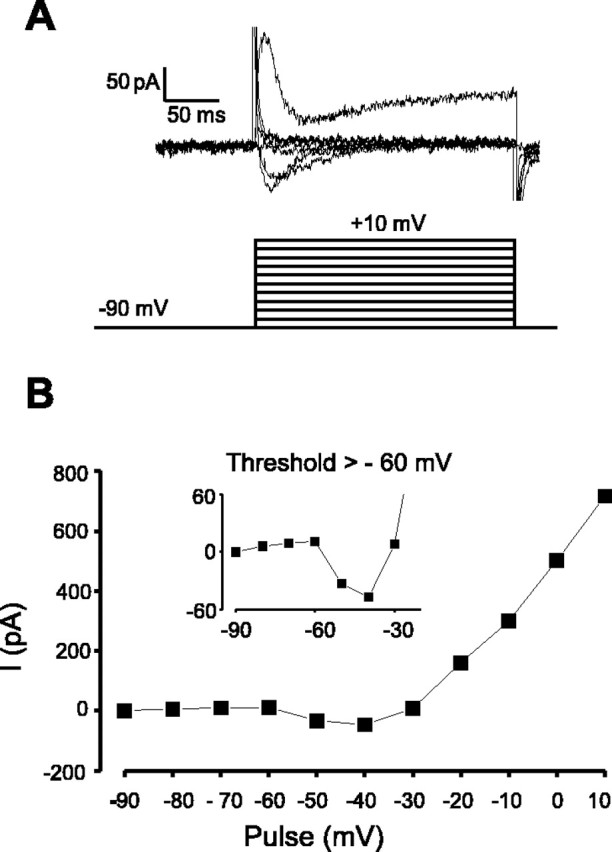
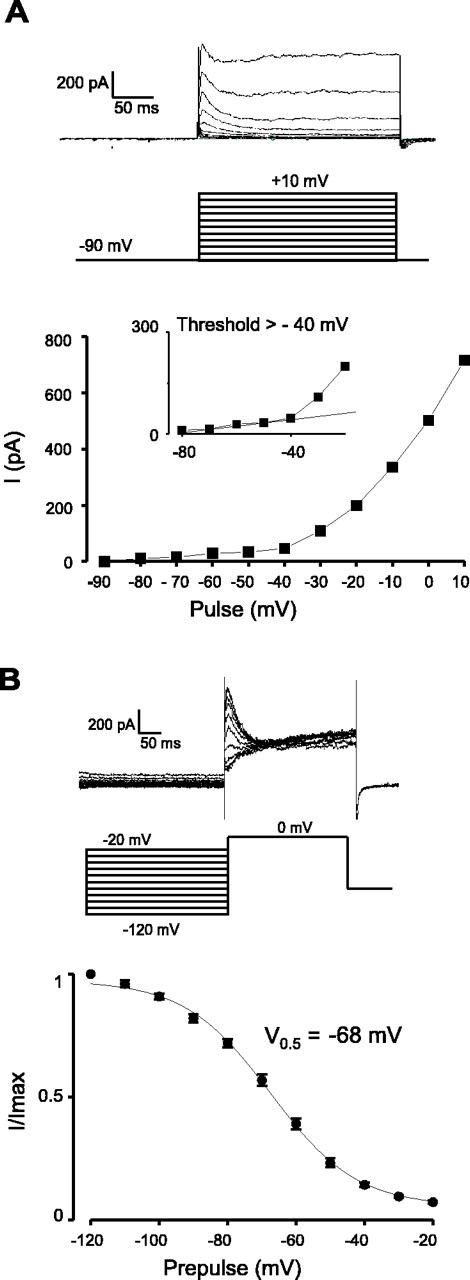
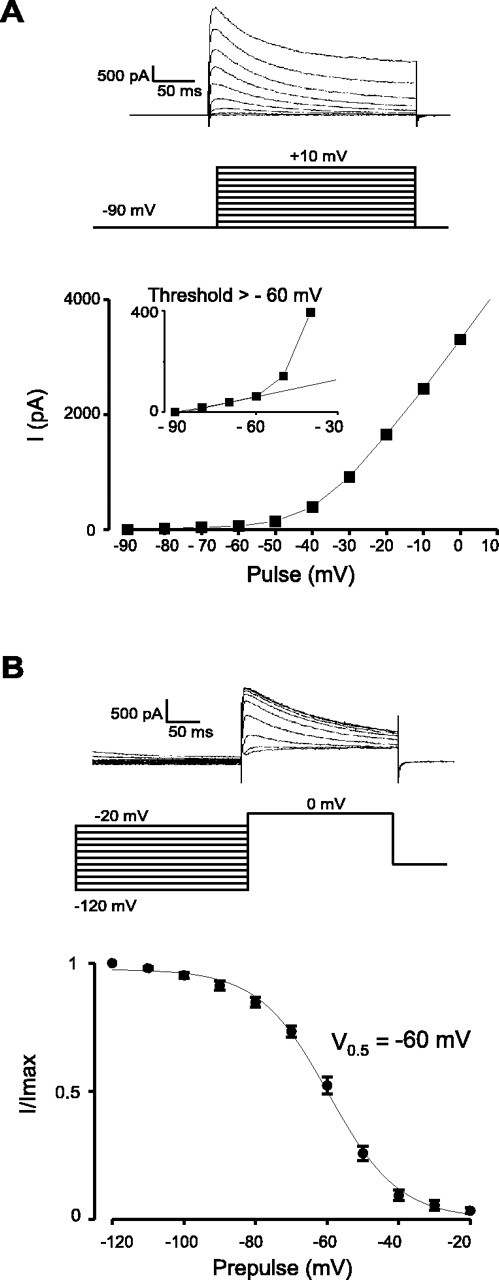
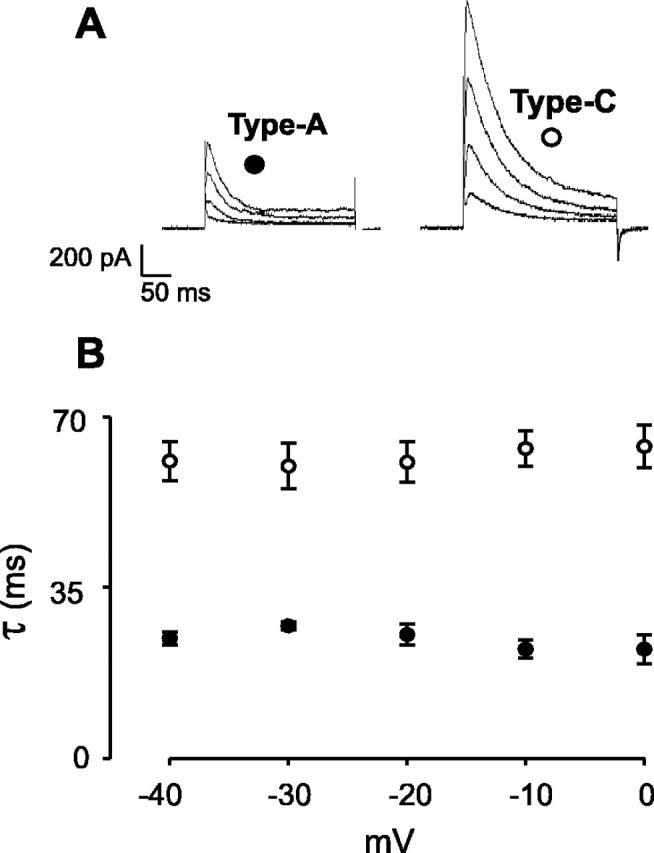
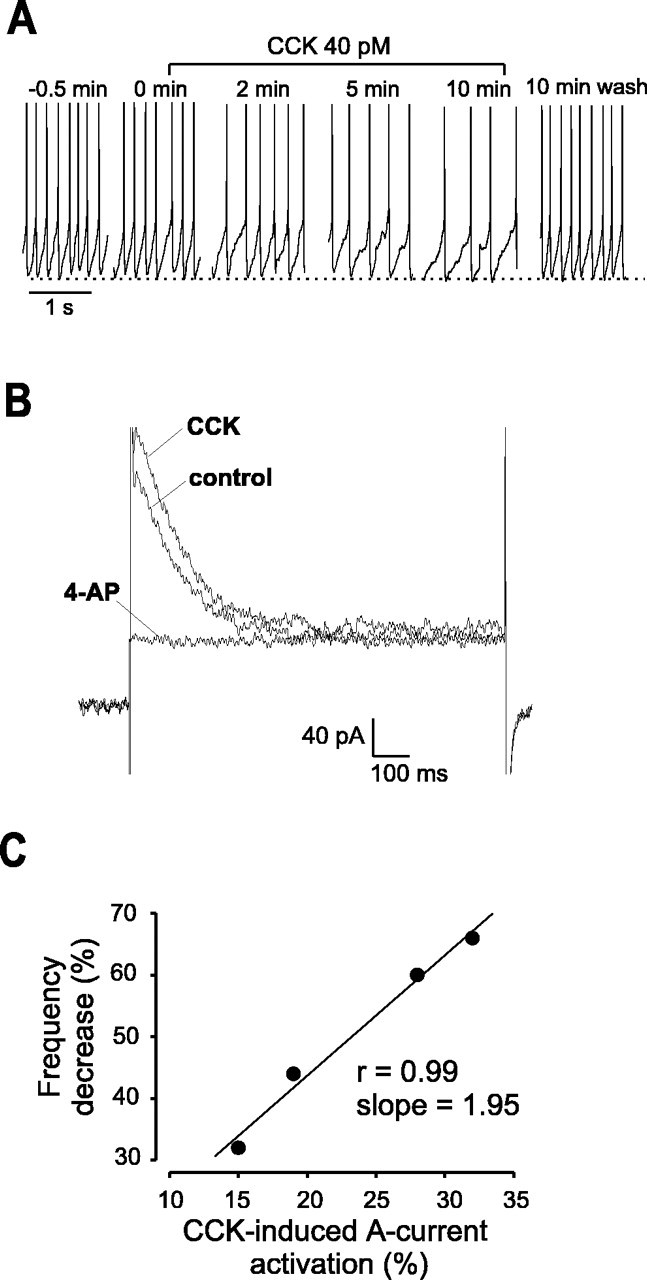
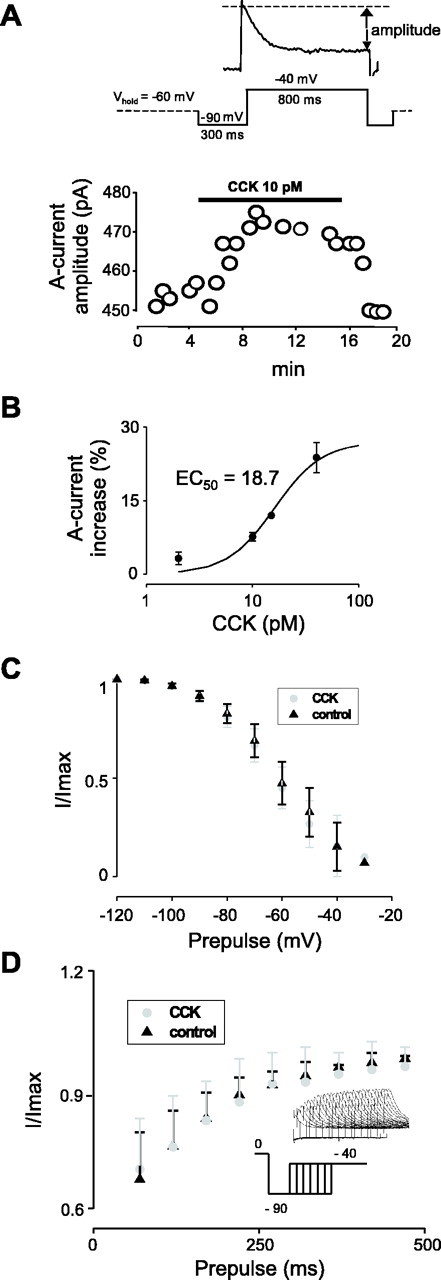
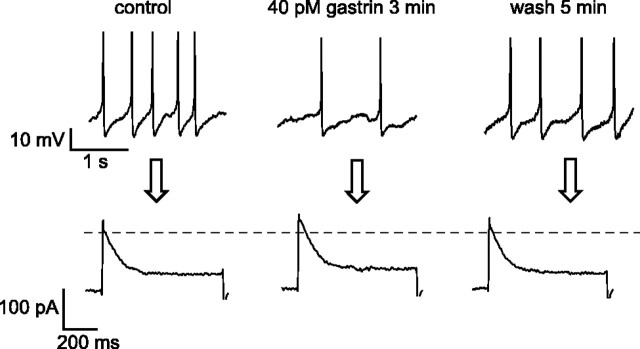
The physiological activity of hypothalamic arcuate nucleus (ARC) neurons is critical for dynamic maintenance of body energy homeostasis, and its malfunction can result in common metabolic disorders, such as obesity. It is therefore of interest to determine which set of ion channels shapes electrical activity in the ARC. Whole-cell patch clamp of ARC neurons in mouse brain slices identified three electrophysiologically distinct types of neurons. These were distinguished by their rebound "signatures" after hyperpolarizing current injection in current clamp and by the presence of transient inward (Type-B neurons) or outward (Type-A and Type-C neurons) subthreshold voltage-gated currents in voltage-clamp recordings. In turn, the transient outward current (A-current) of Type-C neurons had a lower activation threshold and different time and voltage dependence of inactivation than that of Type-A neurons. The brain-gut peptide cholecystokinin (CCK) has long been recognized to control food intake, but how endogenous CCK modulates the activity of central appetite-regulating networks remains unresolved. Here, we show that low (picomolar) concentrations of CCK rapidly and reversibly slow the firing of ARC Type-C neurons. This effect is mediated by postsynaptic CCK-B receptors and is attributable to potentiation of the A-current. Our study thus identifies several fundamental biophysical mechanisms underlying the physiological activity of ARC neurons and suggests a novel mechanism by which endogenous CCK may control appetite.


Figures

Fig. 1.
Fig. 1.
Three distinct electrophysiological phenotypes of ARC neurons. These phenotypes were distinguished by their recovery from hyperpolarizing current injections (30–80 pA) in current clamp (left) and by the currents elicited by a voltage step from −90 to −40 mV in voltage clamp (right). Current- and voltage-clamp protocols are displayed schematically below.A, Type-A ARC cells show no rebound potential (left) and a small, rapidly inactivating outward current (right) in response to repolarization from hyperpolarized potentials. B, Type-B ARC neurons exhibit rebound depolarization (left) and a prominent subthreshold inward current (right). C, Type-C ARC neurons display rebound hyperpolarization (left) and a large outward current that inactivates slowly relative to that of Type-A cells (right). Horizontal lines on thecurrent-clamptraces(left) show the zero-current potential.
Fig. 2.
Fig. 2.
Absence of fast Ihcurrents in ARC neurons. Overlay of membrane potential responses to hyperpolarizing current injections of increasing intensity (left) and currents recorded in response to hyperpolarization from −40 to −120 mV (right) in ARC (A–C) or dorsomedial nucleus (D) neurons. The prominentIh-mediated sag in potential and rapidly activating inward current found for dorsomedial nucleus neurons (D) are not observed for ARC neurons (A–C). Current- and voltage-clamp protocols are shown schematically below representative traces.Horizontal lines on the current-clamp traces (left) indicate the zero potential. Note the difference in current scale in A–C(right).
Fig. 3.
Fig. 3.
Voltage dependence of activation of Ca2+ current in Type-B cells. TTX (700 nm) was added to block Na+ currents.A, Representative example of membrane currents (top) evoked by the voltage protocol below. The cells were held at −90 mV for 300 msec and then stepped to +10 mV in 10 mV increments for 250–300 msec (interpulse interval of 2 sec). B, Peak amplitudes of resulting currents were measured relative to the baseline at −90 mV and plotted against the pulse potential. The data are representative of 10 cells. Theinset is an expansion of the threshold region and shows that the inward current activates between −60 and −50 mV.
Fig. 4.
Fig. 4.
Voltage dependence of A-current activation and inactivation in ARC Type-A neurons. TTX (700 nm) was added to block Na+ currents. A , Current–voltage relationship. The protocol is the same as in Figure 3. The data are representative of 12 cells. The inset is an expansion of the threshold region and shows that the A-current diverges from the linear leak current at potentials positive to −40 mV.B, Voltage dependence of inactivation. Themiddle and top parts show the voltage-clamp protocol and an example of the data obtained, respectively. The protocol consisted of a 300 msec prepulse to between −120 and −20 mV (in 10 mV increments), followed by a 250 msec test pulse to 0 mV. The peak currents during the test pulse were expressed as a fraction of the maximum and plotted against the prepulse potential (bottom; n = 7). The line is the best fit of the data to the Boltzman equation (see Materials and Methods).
Fig. 5.
Fig. 5.
Voltage dependence of A-current activation and inactivation in ARC Type-C neurons. TTX (700 nm) was added to block Na+ currents. A, Whole-cell currents (top), voltage protocol (middle), and current–voltage relationship (bottom). The data are representative of 12 cells. Theinset is an expansion of the threshold region and shows that the A-current diverges from the linear leak current at potentials positive to −60 mV. B, Voltage dependence of inactivation (n = 6). The line is the best fit of the data to the Boltzman equation. All protocols are the same as in Figure 4.
Fig. 6.
Fig. 6.
A-Current inactivation is slower in Type-C than in Type-A neurons. TTX (700 nm) was added to block Na+ currents. A, Examples of A-currents elicited by steps from −40 to 0 mV from a holding potential of −90 mV. A monoexponential fit (I =I0 + Aexp{−(tt0)/τ}) to the A-current decay was used to calculate the inactivation time constant, τ.B, Voltage dependence of τ in Type-C cells (open circles; n = 5) and Type-A cells (filled circles; n = 5).
Fig. 7.
Fig. 7.
CCK slows firing and activates A-currents in ARC Type-C neurons. A, Membrane potential recordings of a Type-C neuron before, during, and after CCK application. Action potentials are truncated at 0 mV, and the dotted lineindicates −50 mV. B, Voltage-clamp recordings of the corresponding A-currents taken from the same cell. The cell was held at −90 mV for 300 msec and then stepped to −40 mV for 800 msec to elicit the A-current. Note that the peak A-current is greater in the presence CCK, but the steady-state current amplitude is unchanged (see Results). 4-AP at 10 mm abolished the A-current. Thetraces in A and B are representative of four cells. C, CCK-induced decrease in firing frequency plotted against the percentage of activation of the A-current for four different neurons. There is a strong linear correlation (r = 0.99; slope of 1.95).
Fig. 8.
Fig. 8.
Pharmacological and kinetic analysis of CCK modulation of A-currents in ARC Type-C neurons. TTX (1 μm) was present to block Na+ currents.A, Time course of A-current increase by CCK. Theinset shows the voltage-clamp protocol used to monitor the A-current amplitude. The figure is representative of responses in eight cells. B, Relationship between CCK concentration and the increase in A-current ampli- tude. The line is drawn to the Hill equation with EC50 of 18.7 and h = 1.32 (n = 12). For details, see Results.C, The voltage dependence of A-current inactivation (measured as in Fig. 5B) was not significantly shifted by CCK (n = 5; control,V0.5 = −58 ± 2 mV; CCK,V0.5 = −60 ± 1 mV;p > 0.1). D, Time dependence of A-current recovery from inactivation. Cells were held at 0 mV for 500 msec to inactivate A-currents and then stepped to −90 mV for varying durations to remove inactivation, after which the A-current amplitude was measured at −40 mV. The inset shows the protocol and an example of the data obtained. CCK did not significantly change the time dependence of recovery from inactivation (n = 3).
Fig. 9.
Fig. 9.
CCK slows firing and activates A-currents in ARC Type-C cells by acting on CCK-B receptors. Top trace, Expansions of membrane potential recordings before, during, and after application of 40 pm gastrin. Action potentials are truncated at 0 mV. Bottom traces, Corresponding A-currents, measured using the same protocol as in Figure8A. The data are representative of four cells.

References

    1. Aghajanian GK. Modulation of a transient outward current in serotonergic neurons by α1-adrenoceptors. Nature. 1985;315:501–503. - PubMed
    1. Baldwin BA, Parrot RF, Ebenezer IS. Food for thought: a critique on the hypothesis that endogenous cholecystokinin acts as a physiological satiety factor. Prog Neurobiol. 1998;55:477–507. - PubMed
    1. Barsch GS, Farooqi IS, O'Rahilly SO. Genetics of body weight regulation. Nature. 2000;404:644–651. - PubMed
    1. Broadwell RD, Brightman MW. Entry of peroxidase into neurons of the central and peripheral nervous systems from extracerebral and cerebral blood. J Comp Neurol. 1976;166:257–283. - PubMed
    1. Brown HF, DiFrancesco D, Noble SJ. How does adrenaline accelerate the heart? Nature. 1979;280:235–236. - PubMed

Publication types

MeSH terms

LinkOut - more resources