. 2002 Aug 1;22(15):6499-506.
doi: 10.1523/JNEUROSCI.22-15-06499.2002.

Localization of the activation gate for small conductance Ca2+-activated K+ channels

Affiliations

Localization of the activation gate for small conductance Ca2+-activated K+ channels

Andrew Bruening-Wright et al. J Neurosci. .

Abstract

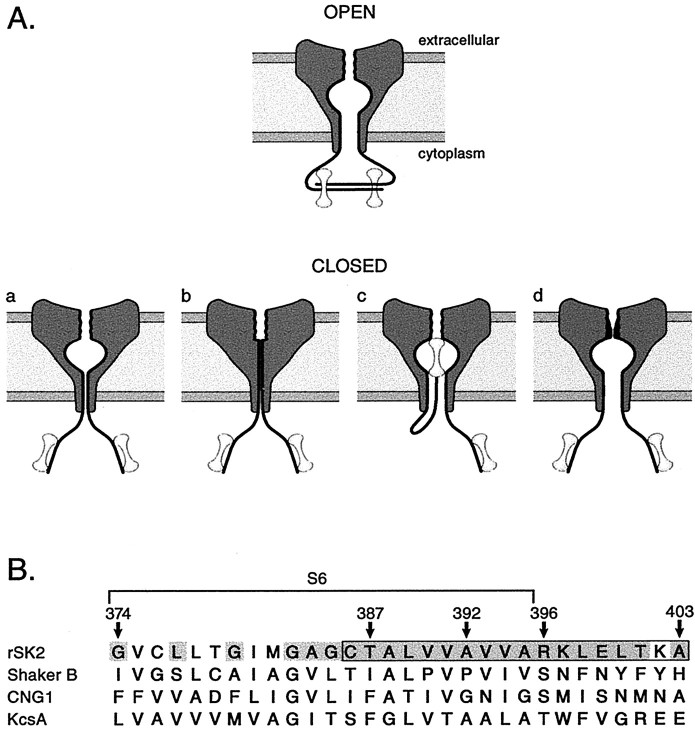
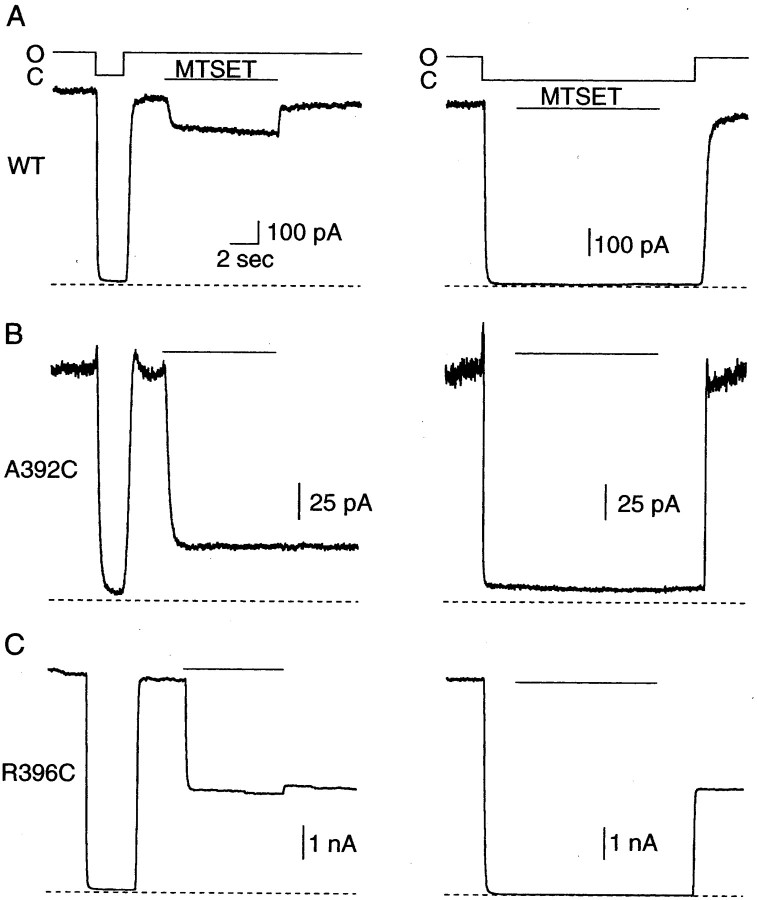
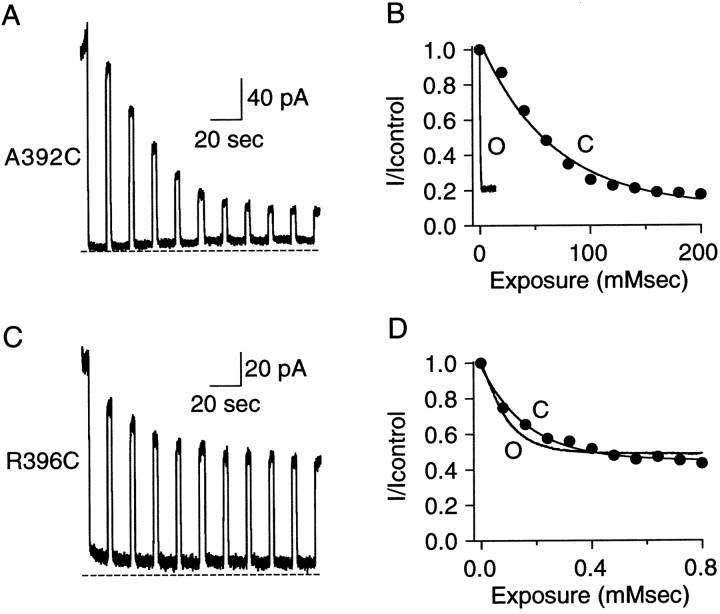
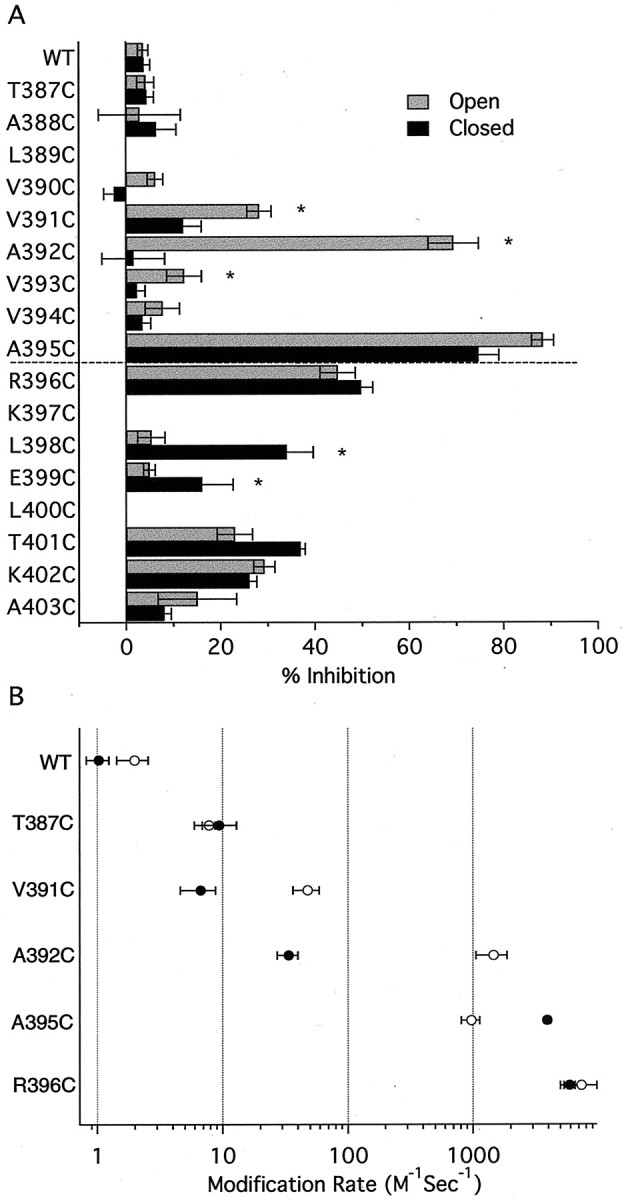
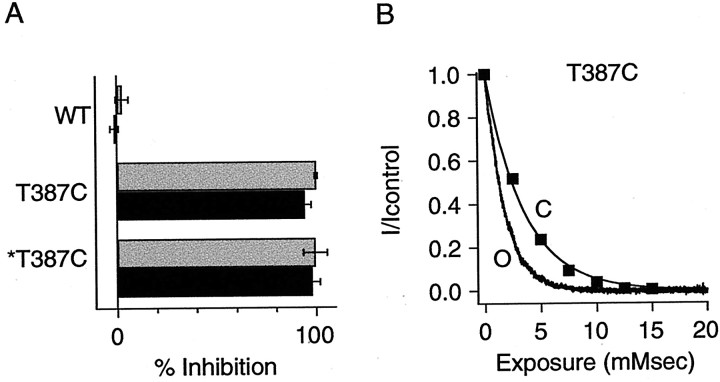
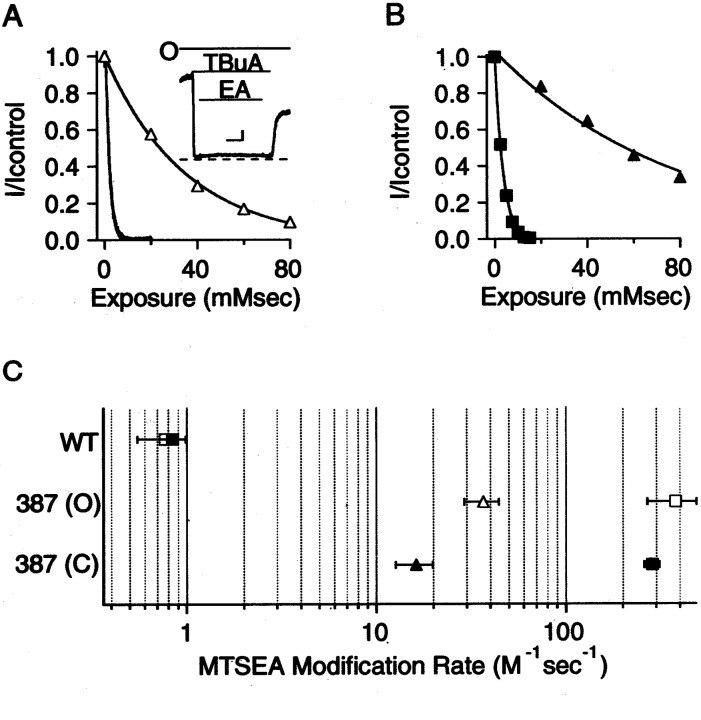
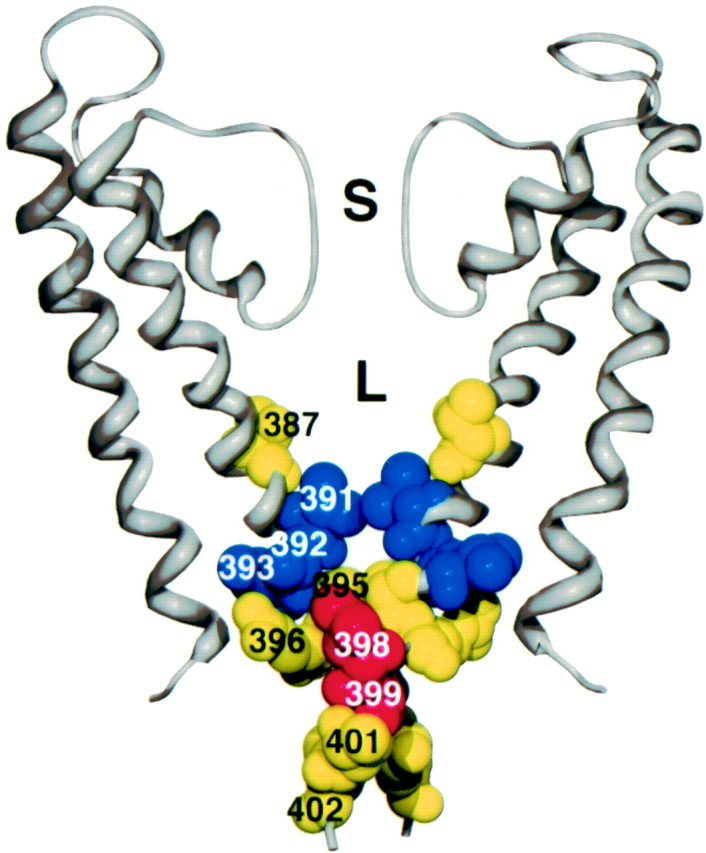
Small conductance Ca2+-activated K+ (SK) channels open in response to increased cytosolic Ca2+ and contribute to the afterhyperpolarization in many excitable cell types. Opening of SK channels is initiated by Ca2+ binding to calmodulin that is bound to the C terminus of the channel. Based on structural information, a chemomechanical gating model has been proposed in which the chemical energy derived from Ca2+ binding is transduced into a mechanical force that restructures the protein to allow K+ ion conduction through the pore. However, the residues that comprise the physical gate of the SK channels have not been identified. In voltage-gated K+ (Kv) channels, access to the inner vestibule is controlled by a bundle crossing formed by the intracellular end of the sixth transmembrane domain (S6) of each of the four channel subunits. Probing SK channels with internally applied quaternary amines suggests that the inner vestibules of Kv and SK channels share structural similarity. Using substituted cysteine accessibility mutagenesis, the relatively large molecule [2-(trimethylammonium)] methanethiosulfonate accessed positions near the putative bundle crossing more rapidly in the open than the closed state but did not modify S6 positions closer to the selectivity filter. In contrast, the smaller compound, 2-(aminoethyl) methanethiosulfonate (MTSEA), modified a position predicted to lie in the lumen immediately intracellular to the selectivity filter equivalently in the open and closed states. The pore blocker tetrabutylammonium impeded MTSEA access to this position in both open and closed channels. The results suggest that the SK channel gate is not formed by the cytoplasmic end of S6 but resides deep in the channel pore in or near the selectivity filter.


Figures

Fig. 1.
Fig. 1.
Possible SK channel-gating mechanisms.A, SK channel-gating models. In each model, two of four subunits are depicted in cross section embedded in the membrane with CaM (dumbbells) associated with the intracellular C-terminal domain. For the open state, the SK–CaM complex is modeled as a dimer-of-dimers, as indicated by the CaMBD/Ca2–CaM crystal structure. In the four closed-state models (a–d), the CaMBD/CaM complex is monomeric (Schumacher et al., 2001). a, The S6 bundle crossing acts as the gate preventing access to the lumen and selectivity filter, as suggested for Kv and KcsA channels.b, Collapse of the inner vestibule, including the aqueous lumen, closes SK channels. c, CaM may act as a blocking particle in a ball-and-chain type mechanism. d, Selectivity filter rearrangement prevents ion permeation in closed SK channels, as suggested for ligand-gated CNG channels. B, Sequence alignments of S6 and proximal cytoplasmic residues of Shaker B, a cyclic nucleotide-gated channel (CNG1), and the proton-gated bacterial K+ channel KcsA. Boxed region, Amino acids 386–403 examined with the SCAM technique in this study. Numbered arrows, Residues of particular importance (see Results). Shaded residues, Residues conserved in all SK family members.
Fig. 2.
Fig. 2.
MTSET reactivity in WT and cysteine-substituted SK2 channels. A–C, Representative traces showing open- and closed-state MTSET reactivity for WT, A392C, and R396C, respectively. For open-state experiments (left), channels were first closed and then reopened using saturating Ca2+ solutions to verify adequate exchange rates. Next, MTSET (1 mm) was applied to open channels for 8 sec, MTSET was washed out, and current amplitudes before and after MTSET application were compared. For closed-state experiments (right), MTSET (1 mm) was applied to closed channels (0 Ca2+) for 8 sec and washed out with 0 Ca2+ solution for 2 sec, channels were reopened, and current amplitudes were compared before and after closed-state application. Bars above the traces indicate when MTSET was applied, the dashed line indicates 0 current level, and the solid lineabove the trace indicates Ca2+ steps from saturating (1 μm; O, open state) to 0 Ca2+ (<2 nm; C, closed state) solution.
Fig. 3.
Fig. 3.
Determination of MTSET modification rates.A, Repeated closed-state 1 mm MTSET application to A392C channels using the protocol of Figure 2.B, Open-state (O, black trace) and closed-state (C, ●) decay time courses for A392C normalized to control current and plotted versus the product of cumulative MTSET exposure and MTSET concentration (mmsec). The open-state trace is taken from Figure2B, and the closed-state decay is determined by measuring current amplitude after each of the 10 applications of MTSET shown in A. A single exponential was fit to the data yielding an exponential constant of 0.2 and 65.9 mmsec for the open and closed state, respectively. C, Closed-state modification at position R396C. Channels were repeatedly exposed to 10 μm MTSET according to the closed-state protocol shown in Figure 2. D, Open-state (O, solid trace) and closed-state (C, ●) decay time courses of R396C normalized as in B. The open-state trace is taken from Figure 2C, and the closed-state rate was determined by measuring the current amplitude after each of the 10 applications of MTSET shown in A. A single exponential was fit to the data yielding an exponential constant of 0.09 and 0.17 mm for open and closed states, respectively.
Fig. 4.
Fig. 4.
Summary of MTSET reactivity for WT and cysteine-substituted channels. A, Reactivity was measured for open (gray bars) or closed (black bars) channels, and the dashed line indicates the predicted boundary between the cytoplasm and membrane. Data from n ≥ 3 patches were normalized and averaged and plotted as the percentage of inhibition ±SEM after an 8 sec exposure to 1 mm MTSET. Note that positions 391, 392, and 393 show stronger open- than closed-state reactivity, whereas positions at the predicted membrane/cytoplasm boundary (395 and 396) show equal open- and closed-state reactivity. Cytoplasmic positions (398 and 399) show stronger closed- than open-state reactivity. ∗Statistically significant differences between open- and closed-state reactivity (p < 0.05). Reactivity at position 390 could not be reliably measured (<10% current reduction).B, Open-state (○) and closed-state (●) modification rates for WT, T387C, and four residues in the putative bundle-crossing region. Rates were determined from single exponential fits to current decay (see Results) and are presented as mean ± SEM fromn ≥ 3 patches.
Fig. 5.
Fig. 5.
MTSEA reactivity for WT, T387C, and T387C/C386S channels. A, Current reduction was determined for the three channels using 8 sec applications of 2.5 mm MTSEA, as described for MTSET in Figure 2. ∗T387C, T387C in the C386S background. B, Open-state (O,black trace) and closed-state (C, ▪) modification of T387C by MTSEA. Data are plotted and fitted as for MTSET in Figure 3. Single exponential fits to the data yielded exponential constants of 1.7 and 3.5 mmsec for open and closed states, respectively.
Fig. 6.
Fig. 6.
TBuA protects T387C from MTSEA modification.A, TBuA protects T387C from modification by MTSEA in the open state. The open-state modification time course without TBuA (black trace) is the same as in Figure5B. The open-state modification time course in the presence of 10 mm TBuA (∼97% block, ▵) was determined by repeatedly applying 2.5 mm MTSEA for 8 sec to blocked channels (inset) and measuring the fractional current remaining after each exposure (inset shows an example of a single exposure; dashed line represents zero current). Calibration (inset): 50 pA, 2 sec; barsindicate when TBuA and MTSEA were applied to open (O) channels. Single exponential fits to the data yielded exponential constants of 1.7 and 34.9 mmsec in the absence and presence of blocker, respectively. B, TBuA protects T387C from modification by MTSEA in the closed state. The closed-state modification time course with no blocker present (▪) is taken from Figure 5B. The closed-state modification time course in the presence of TBuA (▴) was determined by repeatedly applying 2.5 mm MTSEA for 8 sec to closed channels in the presence of TBuA and measuring the fractional current remaining after each exposure. Single exponential fits to the data yielded exponential constants of 3.7 and 77.5 mmsec in the absence and presence of blocker, respectively. C, The WT channel MTSEA modification rate in the open state (■) and closed state (▪) was <1 M−1sec−1. The open-state MTSEA modification rate of T387C without (■) and with (▵) 10 mm TBuA present and the closed-state MTSEA modification rate of T387C without (▪) and with (▴) 10 mm TBuA are shown. Data are presented as mean ± SEM fromn ≥ 3 patches.
Fig. 7.
Fig. 7.
Model of SK2 residues substituted into the KcsA crystal structure. Two of four subunits are shown (gray ribbon). For each subunit, S5, the pore region, S6, and the S6 extension into the cytoplasm are shown. For reference, the selectivity filter at the top (S) is ∼3.3 Å wide.L, The lumen immediately internal to the selectivity filter. Amino acids in yellow (387,395, 396, 401, and402) show approximately equal open- and closed-state reactivity, blue residues (391,392, and 393) show more open-state than closed-state reactivity, and red (398 and399) shows more closed-state than open-state reactivity. Reactivity to MTSET is shown for all residues except T387C, which depicts MTSEA reactivity.

References

    1. Armstrong CM, Hille B. The inner quaternary ammonium ion receptor in potassium channels of the node of Ranvier. J Gen Physiol. 1972;59:388–400. - PMC - PubMed
    1. Becchetti A, Gamel K, Torre V. Cyclic nucleotide-gated channels. Pore topology studied through the accessibility of reporter cysteines. J Gen Physiol. 1999;114:377–392. - PMC - PubMed
    1. Choi KL, Aldrich RW, Yellen G. Tetraethylammonium blockade distinguishes two inactivation mechanisms in voltage-activated K+ channels. Proc Natl Acad Sci USA. 1991;88:5092–5095. - PMC - PubMed
    1. Choi KL, Mossman C, Aube J, Yellen G. The internal quaternary ammonium receptor site of Shaker potassium channels. Neuron. 1993;10:533–541. - PubMed
    1. del Camino D, Yellen G. Tight steric closure at the intracellular activation gate of a voltage-gated K+ channel. Neuron. 2001;32:649–656. - PubMed

Publication types

MeSH terms

LinkOut - more resources