

Serotonin clearance in vivo is altered to a greater extent by antidepressant-induced downregulation of the serotonin transporter than by acute blockade of this transporter
- PMID: 12151556
- PMCID: PMC6758131
- DOI: 10.1523/JNEUROSCI.22-15-06766.2002
Serotonin clearance in vivo is altered to a greater extent by antidepressant-induced downregulation of the serotonin transporter than by acute blockade of this transporter
Abstract
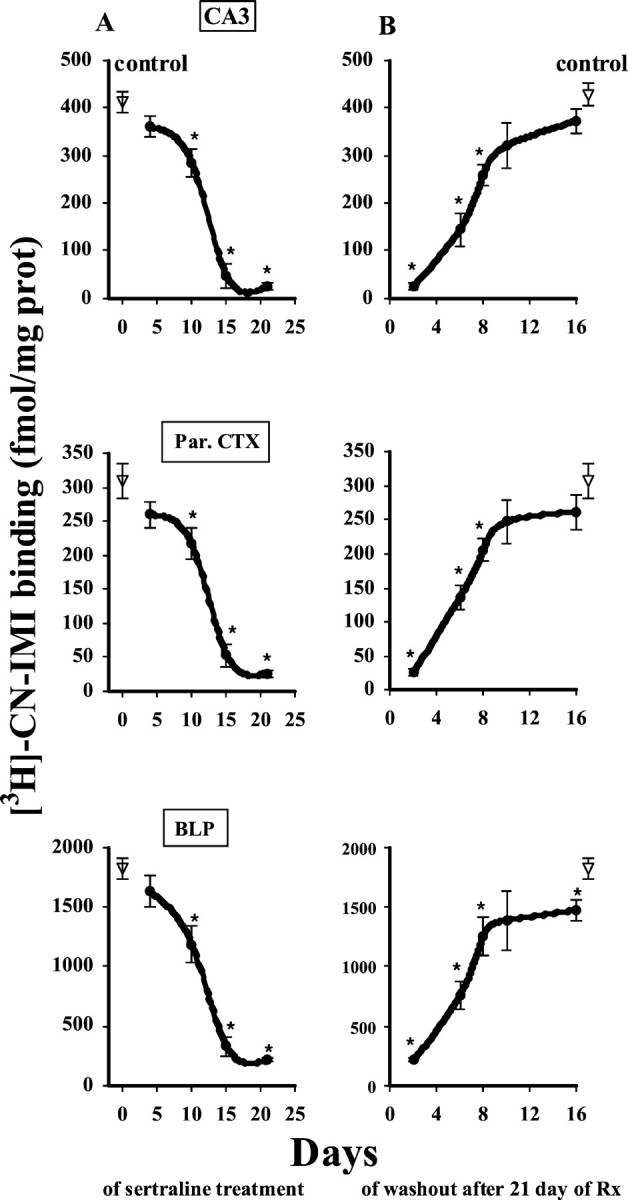
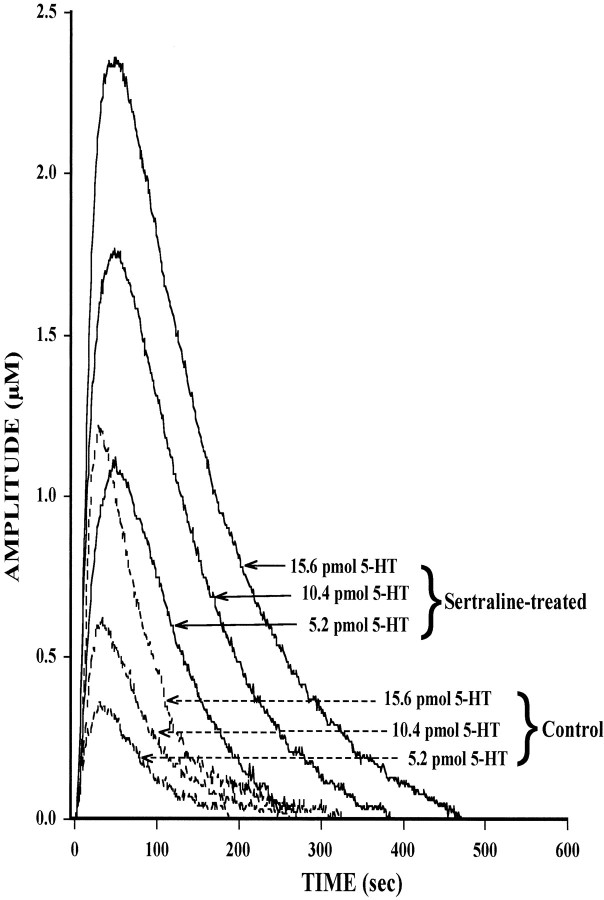
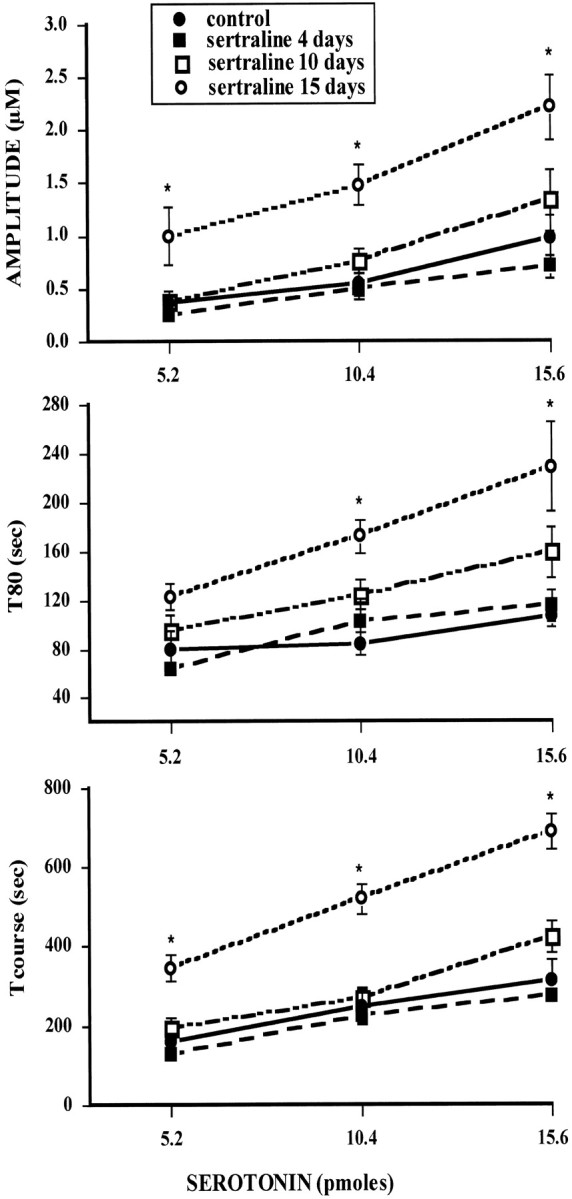
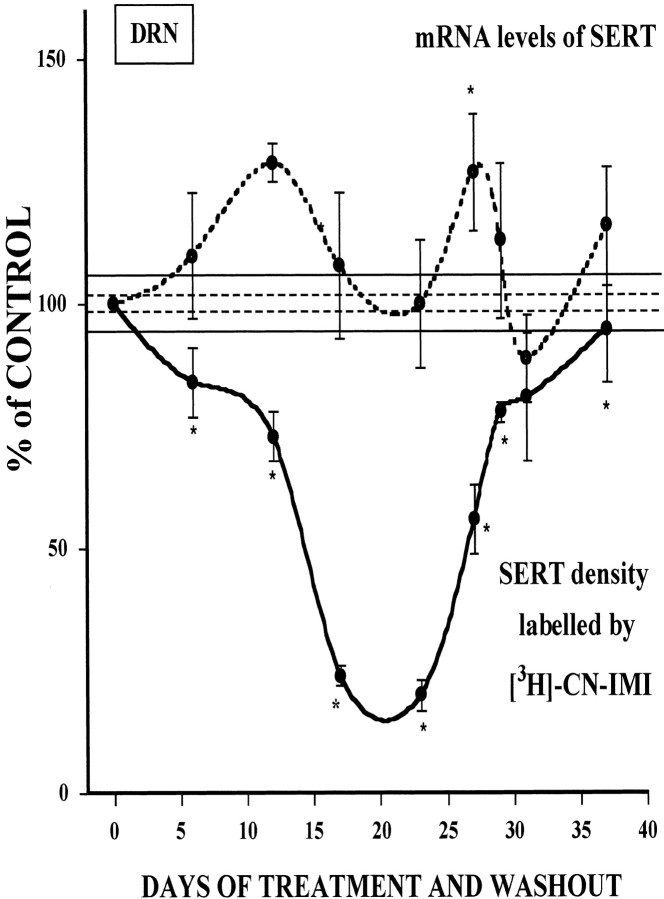
Serotonin uptake, mediated by the serotonin transporter (SERT), is blocked acutely by antidepressants such as the selective serotonin reuptake inhibitors (SSRIs), but such blockade does not correlate temporally with the onset of therapeutic improvement. Treatment with SSRIs for 21 d induced downregulation of the SERT (Benmansour et al., 1999). The time course of SERT downregulation as well as the time course for its recovery after cessation of treatment with the SSRI sertraline were investigated using tritiated cyanoimipramine to measure SERT binding sites. To determine if there was a temporal correlation between the time when sertraline induced downregulation of the SERT and when marked alteration in SERT function occurred, clearance of locally applied 5-HT into the CA3 region of hippocampus was achieved using in vivo electrochemistry. After 4 or 10 d treatment with sertraline, SERT binding sites decreased very little (15-30%), and the chronoamperometric signals for serotonin in sertraline-treated rats were comparable with ones obtained in control animals. By contrast, after 15 d of treatment, when SERT binding sites were markedly reduced by 80%, there was robust decrease in the clearance of 5-HT. Moreover, the functional consequences of SERT downregulation as measured by chronoamperometry were significantly greater than those seen after acute blockade of the SERT by SSRIs. SERT binding sites decreases are not a consequence of reduced SERT gene expression, as revealed by in situ hybridization measurements. SSRI-induced downregulation of the SERT may be a key component for the clinical response to SSRIs.
Figures
Similar articles
-
Effects of chronic antidepressant treatments on serotonin transporter function, density, and mRNA level.J Neurosci. 1999 Dec 1;19(23):10494-501. doi: 10.1523/JNEUROSCI.19-23-10494.1999. J Neurosci. 1999. PMID: 10575045 Free PMC article.
-
Serotonin (5-HT) transporter (SERT) function after graded destruction of serotonergic neurons.J Neurochem. 2003 Nov;87(4):861-7. doi: 10.1046/j.1471-4159.2003.02032.x. J Neurochem. 2003. PMID: 14622117
-
Transport mechanisms governing serotonin clearance in vivo revealed by high-speed chronoamperometry.J Neurosci Methods. 2005 Apr 15;143(1):49-62. doi: 10.1016/j.jneumeth.2004.09.011. J Neurosci Methods. 2005. PMID: 15763136
-
Structure, function and regulation of the 5-hydroxytryptamine (serotonin) transporter.Biochem Soc Trans. 2001 Nov;29(Pt 6):728-32. doi: 10.1042/0300-5127:0290728. Biochem Soc Trans. 2001. PMID: 11709064 Review.
-
[Escitalopram: a selective inhibitor and allosteric modulator of the serotonin transporter].Encephale. 2007 Dec;33(6):965-72. doi: 10.1016/j.encep.2007.11.001. Epub 2007 Dec 11. Encephale. 2007. PMID: 18789789 Review. French.
Cited by
-
Non-coding RNAs--novel targets in neurotoxicity.Neurotoxicology. 2012 Jun;33(3):530-44. doi: 10.1016/j.neuro.2012.02.013. Epub 2012 Feb 27. Neurotoxicology. 2012. PMID: 22394481 Free PMC article. Review.
-
Decynium-22 enhances SSRI-induced antidepressant-like effects in mice: uncovering novel targets to treat depression.J Neurosci. 2013 Jun 19;33(25):10534-43. doi: 10.1523/JNEUROSCI.5687-11.2013. J Neurosci. 2013. PMID: 23785165 Free PMC article.
-
Toward a multiscale modeling framework for understanding serotonergic function.J Psychopharmacol. 2017 Sep;31(9):1121-1136. doi: 10.1177/0269881117699612. Epub 2017 Apr 18. J Psychopharmacol. 2017. PMID: 28417684 Free PMC article. Review.
-
Serotonin synthesis, release and reuptake in terminals: a mathematical model.Theor Biol Med Model. 2010 Aug 19;7:34. doi: 10.1186/1742-4682-7-34. Theor Biol Med Model. 2010. PMID: 20723248 Free PMC article.
-
Fluoxetine-induced alterations in human platelet serotonin transporter expression: serotonin transporter polymorphism effects.J Psychiatry Neurosci. 2006 Sep;31(5):333-9. J Psychiatry Neurosci. 2006. PMID: 16951736 Free PMC article.
References
-
- Artigas F, Celada P, Laruelle M, Adell A. How does pindolol improve antidepressant action? Trends Pharmacol Sci. 2001;22:224–228. - PubMed
-
- Bel N, Artigas F. Chronic treatment with fluvoxamine increases extracellular serotonin in frontal cortex but not in raphe nuclei. Synapse. 1993;15:243–245. - PubMed
Publication types
MeSH terms
Substances
Grants and funding
LinkOut - more resources
Full Text Sources
Other Literature Sources
Medical
Miscellaneous