. 2002 Aug 1;542(Pt 3):817-28.
doi: 10.1113/jphysiol.2002.020586.

Passive water and urea permeability of a human Na(+)-glutamate cotransporter expressed in Xenopus oocytes

Affiliations

Passive water and urea permeability of a human Na(+)-glutamate cotransporter expressed in Xenopus oocytes

Nanna MacAulay et al. J Physiol. .

Abstract

The human Na(+)-glutamate transporter (EAAT1) was expressed in Xenopus laevis oocytes. The passive water permeability, L(p), was derived from volume changes of the oocyte induced by changes in the external osmolarity. Oocytes were subjected to two-electrode voltage clamp. In the presence of Na(+), the EAAT1-specific (defined in Discussion) L(p) increased linearly with positive clamp potentials, the L(p) being around 23 % larger at +50 mV than at -50 mV. L-Glutamate increased the EAAT1-specific L(p) by up to 40 %. The K(0.5) for the glutamate-dependent increase was 20 +/- 6 microM, which is similar to the K(0.5) value for glutamate activation of transport. The specific inhibitor DL-threo-beta-benzyloxyaspartate (TBOA) reduced the EAAT1-specific L(p) to 72 %. EAAT1 supported passive fluxes of [(14)C]urea and [(14)C]glycerol. The [(14)C]urea flux was increased in the presence of glutamate. The data suggest that the permeability depends on the conformational equilibrium of the EAAT1. At positive potentials and in the presence of Na(+) and glutamate, the pore is enlarged and water and urea penetrate more readily. The L(p) was larger when measured with urea or glycerol as osmolytes as compared with mannitol. Apparently, the properties of the pore are not uniform along its length. The outer section may accommodate urea and glycerol in an osmotically active form, giving rise to larger water fluxes. The physiological role of EAAT1 for water homeostasis in the central nervous system is discussed.


Figures
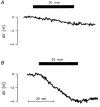
Figure 1
Figure 1. Passive water permeability (Lp) of EAAT1-expressing oocytes
A, an example of the volume change of a non-injected oocyte during an hyperosmolar challenge of 20 mosmol l−1 of mannitol (black bar). B, an example of the response of an EAAT1-expressing oocyte to an hyperosmolar challenge of 20 mosmol l−1 of mannitol (black bar). The EAAT-specific Lp was determined as the difference between the initial rates of shrinkage observed between native (non-injected) oocytes and EAAT1-expressing oocytes from the same batch, see Discussion.
Figure 2
Figure 2. Lp as a function of the osmotic gradient
EAAT1-expressing oocytes were exposed to hyperosmolar challenges of 20, 50, 100, 200, or 400 mosmol l−1 of urea (•) or mannitol (○). Data are presented as the Lp relative to the Lp obtained with 20 mosmol l−1 mannitol, an average of three oocytes. The Lps derived (slope of the lines) were independent of the magnitude of osmotic gradients up to 200 mosmol l−1, whereas the Lps obtained with 400 mosmol l−1 were significantly lower than those obtained with the smaller osmolarities.
Figure 3
Figure 3. Lp as a function of external parameters
A, Lp obtained at different clamp potentials. The Lp was a linear function of the clamp potential. For the typical oocyte shown, the regression line had the slope: 2. 1 ± 0. 2 × 10⁻⁸ cm s−1 (osmol l−1)−1 mV−1 (r / 0. 88). B, Lp as a function of the glutamate concentration (Glu). The oocyte was clamped to −30 mV (•) or +30 mV (○). Glutamate was present in both control and test solutions. In both cases, Lp was an increasing and saturable function of the glutamate concentration. The data were fitted to a Michaelis-Menten equation, see text. C, the effect of glutamate on Lp was abolished if Ch+ completely replaced Na+ in the bathing solution; oocytes were clamped to −30 mV. D, there was no effect of the Na+ concentration on the Lp. Different Na+ concentrations were obtained by Ch+ replacement. The membrane potential of the oocytes was clamped to −40 mV and no glutamate was present. Data in each panel are from one oocyte representing at least three oocytes.
Figure 4
Figure 4. Lp with different osmolytes
The Lps were obtained with 20 mosmol l−1 mannitol, urea, glycerol, acetamide, or formamide as osmolyte. Data are presented as the average Lp obtained with the osmolyte relative to that obtained with mannitol, Lp, man. Man, mannitol; Urea, urea; Gly, glycerol; Acet, acetamide; Form, formamide (n = 7–8 oocytes). The t test represents the significance of the difference between the Lp obtained with the osmolyte and that of mannitol, *** P < 0.001; ** 0.001 < P < 0.01.
Figure 5
Figure 5. Uptake of [14C]mannitol, urea or glycerol
The oocytes were incubated for 30 min with 50 μmol l−1 [14C]mannitol, urea, or glycerol in the absence of glutamate. The data are from one representative batch (out of four, comprising five oocytes for each experimental condition). The open bars represent the uptake into native oocytes, and the black bars represent the uptake into EAAT1-expressing oocytes. The t test represents the significance of the isotope uptake into the EAAT1-expressing oocyte as compared with the native oocytes. *** P < 0.001.
Figure 6
Figure 6. Uptake of [14C]urea under voltage clamp
The oocytes were voltage clamped to −50 or +30 mV and exposed for 10 min to [14C]urea in the presence (+) or absence (-) of 100 μmol l−1 glutamate. The data are from one representative batch (out of three, comprising four oocytes for each experimental condition). The black bars represent the uptake into the EAAT1-expressing oocytes and the open bar represents the uptake into non-injected oocytes from the same batch. The t test represents the significance of the increase of the [14C]urea uptake induced by glutamate at a given clamp potential. *** P < 0.001.
Figure 7
Figure 7. [14C]Urea uptake as a function of TBOA
A, the Lp of the EAAT1-expressing oocytes was assessed in the absence of glutamate by the application of 20 mosmol l−1 mannitol. The data are presented as the Lp obtained with 200 μmol l−1 TBOA relative to that obtained under control conditions (n = 3 oocytes). B, oocytes were incubated in test solution for 30 min with 50 μmol l−1 [14C] urea in the absence (-) or presence (+) of 200 μmol l−1 TBOA, glutamate absent. The data are the average of five oocytes from a representative batch; in total three batches were tested. The open bars represent the uptake into non-injected oocytes, and the black bars represent the uptake into EAAT1-expressing oocytes. The t tests represent the significance of the change in the Lp and [14C]urea uptake in EAAT1-expressing oocytes induced by TBOA. *** P < 0.001.
Figure 8
Figure 8. Molecular determinants of the Lp of EAAT1
A, molecular properties of the pore. The data suggest that the outer end of the pore can accommodate urea and glycerol in an osmotic active form, while excluding larger osmolytes such as mannitol. During transport, the profile of water chemical potential (Cw) will differ in the two cases. In case of urea (continuous line), the transmembrane difference in Cw will be present across a shorter portion of the pore. In case of mannitol (dashed line), it will be present across the entire length of the pore. Accordingly, a larger Lp will be measured with urea as osmolyte. As discussed, the exclusion of mannitol could result from steric hindrance or from the properties of the water-protein interphase. B, simplified reaction scheme for EAAT1. The glutamate molecule (▪) and the Na+ ions (○ with positive charge) are shown to be bound from the outside and transported to the inside of the membrane. The ▴ is the inhibitor TBOA. State C3, with glutamate and Na+ bound, exhibited an increased Lp, which is symbolized by a large pore size. State C* with bound TBOA stops the protein in its reaction cycle and is therefore set outside the cycle. The Lp of this state was reduced, indicated by the small pore size. The pathways for K+, H+, and Cl ions have been left out for simplicity. See also Discussion.

Similar articles

Cited by

References

    1. Arriza JL, Eliasof S, Kavanaugh MP, Amara SG. Excitatory amino acid transporter 5, a retinal glutamate transporter coupled to a chloride conductance. Proceedings of the National Academy of Sciences of the USA. 1997;94:4155–4160. - PMC - PubMed
    1. Arriza JL, Fairman WA, Wadiche JI, Murdoch GH, Kavanaugh MP, Amara SG. Functional comparisons of three glutamate transporter subtypes cloned from human motor cortex. Journal of Neuroscience. 1994;14:5559–5569. - PMC - PubMed
    1. Auger C, Attwell D. Fast removal of synaptic glutamate by postsynaptic transporters. Neuron. 2000;28:547–558. - PubMed
    1. Barbour B, Brew H, Attwell D. Electrogenic glutamate uptake in glial cells is activated by intracellular potassium. Nature. 1988;335:433–435. - PubMed
    1. Borgnia MJ, Nielsen S, Engel A, Agre P. Cellular and molecular biology of the aquaporin water channels. Annual Review of Biochemistry. 1999;68:425–458. - PubMed

Publication types

LinkOut - more resources