. 2002 Aug 1;542(Pt 3):843-54.
doi: 10.1113/jphysiol.2001.013987.

Measurement of cytoplasmic calcium concentration in the rods of wild-type and transducin knock-out mice

Affiliations

Measurement of cytoplasmic calcium concentration in the rods of wild-type and transducin knock-out mice

Michael L Woodruff et al. J Physiol. .

Abstract

A 10 microm spot of argon laser light was focused onto the outer segments of intact mouse rods loaded with fluo-3, fluo-4 or fluo-5F, to estimate dark, resting free Ca(2+) concentration ([Ca(2+)](i)) and changes in [Ca(2+)](i) upon illumination. Dye concentration was adjusted to preserve the normal physiology of the rod, and the laser intensity was selected to minimise bleaching of the fluorescent dye. Wild-type mouse rods illuminated continuously with laser light showed a progressive decrease in fluorescence well fitted by two exponentials with mean time constants of 154 and 540 ms. Rods from transducin alpha-subunit knock-out (Tralpha-/-) animals showed no light-dependent decline in fluorescence but exhibited an initial rapid component of fluorescence increase which could be fitted with a single exponential (tau~1-4 ms). This fluorescence increase was triggered by rhodopsin bleaching, since its amplitude was reduced by pre-exposure to bright bleaching light and its time constant decreased with increasing laser intensity. The rapid component was however unaffected by incorporation of the calcium chelator BAPTA and seemed therefore not to reflect an actual increase in [Ca(2+)](i). A similar rapid increase in fluorescence was also seen in the rods of wild-type mice just preceding the fall in fluorescence produced by the light-dependent decrease in [Ca(2+)](i). Dissociation constants were measured in vitro for fluo-3, fluo-4 and fluo-5F with and without 1 mM Mg(2+) from 20 to 37 degrees C. All three dyes showed a strong temperature dependence, with the dissociation constant changing by a factor of 3-4 over this range. Values at 37 degrees C were used to estimate absolute levels of rod [Ca(2+)](i). All three dyes gave similar values for [Ca(2+)](i) in wild-type rods of 250 +/- 20 nM in darkness and 23 +/- 2 nM after exposure to saturating light. There was no significant difference in dark [Ca(2+)](i) between wild-type and Tralpha-/- animals.


Figures
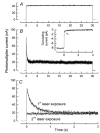
Figure 3
Figure 3. Bright light evokes a rapid decline in fluo-4 fluorescence in wild-type mouse rods without dye bleaching
A, photomultiplier current elicited by fluorescence from a film of fluo-4 pentapotasssium salt immobilised in a high-Ca2+ agarose gel, to a 30 s exposure at a laser intensity comparable to that used for measurements from mouse rods. Trace is the average of four records obtained from different areas of the dye film. B, fluorescence response from a dark-adapted mouse rod loaded with fluo-4 evoked by the first exposure to laser light. C, the same data on an expanded time base illustrating the initial decline in fluorescence, together with a superimposed trace evoked by a second laser exposure 60 s later. The decay in fluorescence was fitted with a double exponential decay (eqn 2) with time constants for this cell of τ1 / 159 ms and τ2 = 508 ms. Inset, mean change in circulating current as a function of time for 12 rods recorded with a suction pipette and exposed to the same laser intensity used for the calcium measurements. For clarity, only the response to the first laser exposure is shown; there was no response to the second, indicating that the circulating current remains suppressed between the two laser presentations. The arrow indicates Na+/Ca2+-K+ exchange current, which could be fitted with two constants of about 40 and 690 ms (continuous curve).
Figure 1
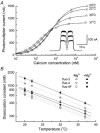
Figure 1. Temperature changes within the physiological range alter the Ca2+ affinity of the fluorescent indicator dyes fluo-3, fluo-4 and fluo-5F
A, effect of temperature on the titration curve for Ca2+ binding to fluo-4 measured at 20 (×), 22 (□), 30 (▵) and 37 °C (□). Ordinate plots photomultiplier current evoked by dye fluorescence as a function of Ca2+ concentration (see Methods). Ca2+ concentrations have been corrected for effects of temperature on Ca2+-EGTA binding, leading to a slight displacement of the values at each temperature for individual solutions. Continuous curves determined according to a sigmoidal logistic model (eqn 1) fitted to the data at each temperature by a least-squares algorithm. Inset, superimposed photomultiplier current traces during fluorescence measurements with fluo-5F and nominally 60 nm Ca2+ at 20, 30 and 37 °C as the plane of focus was moved upward (first maximum) and then downward (second maximum) through the liquid dye film (see Methods). B, plot of dissociation constant against temperature determined for each of the three dyes as in A in the presence and absence of 1 mm Mg2+. Each point represents the mean of three independent determinations; error bars are s.e.m. Thermodynamic parameters calculated from the regression lines fitted to these data are collected in Table 1.
Figure 2
Figure 2. Effect of dye loading on electrical responses of wild-type mouse rods
Mean response-intensity relations measured at the peak of responses to 20 ms light flashes of wavelength 500 nm under control conditions (•, 20 cells) and after incubation for 30 min with 2 μm fluo-3 AM (○, 9 cells), 2.5 μm fluo-4 AM (⋄, 11 cells) and 10 μm fluo-5F AM (□, 20 cells). Error bars denote s.e.m. Inset, superimposed, normalised dim flash responses for control rods (thin trace, 20 cells) and rods pre-incubated with 10 μm fluo-5F AM (thick trace, 25 cells). Mean responses were normalised for each cell before averaging between cells; flash intensity ∼0.75 photons μm−2.
Figure 6
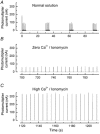
Figure 6. Calibration of the dye fluorescence signals in a wild-type rod pre-incubated with 2 μm fluo-4 AM
A, dark-adapted rod exposed to five 30 ms laser flashes at 1 s intervals; sequence repeated four times at 30 s intervals. Fluorescence intensity evoked by the first laser flash in the first sequence was used to estimate dark-adapted [Ca2+]i, while the fluorescence from subsequent laser flashes was used to estimate [Ca2+]i after saturating light (see text and eqn 3). B, bath perfused with an EGTA-buffered zero Ca2+/ionomycin solution. Single laser flashes were delivered at 5 s intervals until a stable low level of fluorescence (Fmin) was attained (∼10 min in this rod). C, bath perfused with an isotonic Ca2+/ionomycin solution until a stable high level of fluorescence (Fmax) was attained (∼5 min in this rod). In some experiments, ionomycin was omitted from the high Ca2+ solution, since sufficient ionophore seemed to remain in the membrane from the preceding low Ca2+/ionomycin exposure. Estimates of dark-adapted and light-adapted [Ca2+]i derived from such measurements with all three dyes are collected in Table 2.
Figure 4
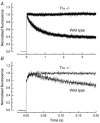
Figure 4. The light-induced decline in dye fluorescence is not present in Trα–/– rods
A, comparison of the time course of the fluorescence signal evoked by laser illumination from dark-adapted Trα–/– and wild-type rods. Lower trace is the average of the responses of eight dark-adapted wild-type rods, each normalised to its initial value; upper trace is the average of the responses of 20 rods from Trα–/– animals individually normalised to the maximum value of the photocurrent. Rods were pre-incubated with 10 μm fluo-5F/AM. Control responses were low-pass filtered at 2 or 50 Hz and acquired at 5 or 1 kHz respectively; Trα–/– responses were filtered at 1 kHz and acquired at 2 kHz. B, time course of fluorescence signal soon after the onset of laser illumination. Note rapid initial fluorescence increase in both wild-type and Trα–/– rods. Data were all filtered over the wider bandwidth of 2-kHz and sampled at 5-kHz; traces are the averages of 46 (transducin knock-out) and 19 (wild-type) normalised responses.
Figure 5
Figure 5. The rapid initial increase in fluorescence of Trα–/– rods is associated with rhodopsin bleaching, but not with an increase in [Ca2+]i
All measurements were from Trα–/– rods pre-incubated with 10 μm fluo-5F/AM. A, comparison of the early fluorescence signal evoked by the first (thin trace) and second (thick trace) exposures to the laser in dark-adapted Trα–/– rods. The first laser exposure was of 4.5 s duration; the second exposure took place 90 s after the first. Traces are the means of the responses of 18 cells, each individually normalised to the initial fluorescence signal immediately after the opening of the laser shutter before the onset of the subsequent rapid increase in fluorescence. Note the presence of the rapid fluorescence increase in response to the first but not subsequent laser exposures in the same rod. B, comparison of the early fluorescence signal in dark-adapted Trα–/– rods (thin trace) and Trα–/– rods pre-exposed to bright white light calculated to bleach ∼40 % of the photopigment (thick trace). Data are the average of 14 (dark-adapted) and 46 (prebleached) normalised responses from rods in the same retinal preparation; the prebleached trace is from the same data as the Trα–/– trace of Fig. 4B on a faster time base. Data low-pass filtered at 2 kHz and sampled at 5 kHz. C, comparison of the rapid initial increase in fluorescence evoked from Trα–/– rods by the standard laser intensity (thin trace, 4.6 × 10¹⁰ photons μm−2 s−1; same data as dark-adapted trace in B) and a 10 times greater laser intensity (thick trace, 4.6 × 10¹¹ photons μm−2 s−1). The trace obtained at the higher laser intensity represents averaged normalised data from 14 Trα–/–rods, and has been constrained to unity near time zero and magnified by a factor of 1.08 to aid comparison with the rapid fluorescence increase at the lower laser intensity. Note the more rapid rise in fluorescence at the higher laser intensity. Data low-pass filtered at 2 kHz and sampled at 5 kHz. D, comparison of the rapid initial increase in fluorescence from dark-adapted Trα–/– rods after BAPTA loading (thick trace, BAPTA) and under control conditions (thin trace, Control). For BAPTA loading the dye incubation solution contained either 50 or 100 μm BAPTA-AM; incubation duration, 30 min. Data are the average of 19 (BAPTA) and 18 (control, same data as first pulse trace in A) normalised responses. No difference was seen between the low and high BAPTA concentrations, so these data have been pooled. Note the persistence of the early fluorescence increase after BAPTA loading. Data low-pass filtered at 1 kHz and sampled at 2 kHz.

Similar articles

Cited by

References

    1. Bassani JW, Bassani RA, Bers DM. Calibration of indo-1 and resting intracellular [Ca2+]i in intact rabbit cardiac myocytes. Biophysical Journal. 1995;68:1453–1460. - PMC - PubMed
    1. Baylor SM, Hollingworth S. Measurement and interpretation of cytoplasmic [Ca2+] signals from calcium-indicator dyes. News in Physiological Sciences. 2000;15:19–26. - PubMed
    1. Calvert PD, Govardovskii VI, Krasnoperova N, Anderson RE, Lem J, Makino CL. Membrane protein diffusion sets the speed of rod phototransduction. Nature. 2001;411:90–94. - PubMed
    1. Calvert PD, Krasnoperova NV, Lyubarsky AL, Isayama T, Nicolo M, Kosaras B, Wong G, Gannon KS, Margolskee RF, Sidman RL, Pugh EN, Jr, Makino CL, Lem J. Phototransduction in transgenic mice after targeted deletion of the rod transducin alpha-subunit. Proceedings of the National Academy of Sciences of the USA. 2000;97:13913–13918. - PMC - PubMed
    1. Chen CK, Burns ME, He W, Wensel TG, Baylor DA, Simon MI. Slowed recovery of rod photoresponse in mice lacking the GTPase accelerating protein RGS9–1. Nature. 2000;403:557–560. - PubMed

Publication types

LinkOut - more resources