. 2002 Aug 1;542(Pt 3):951-61.
doi: 10.1113/jphysiol.2002.018937.

Excitability changes in human peripheral nerve axons in a paradigm mimicking paired-pulse transcranial magnetic stimulation

Affiliations

Excitability changes in human peripheral nerve axons in a paradigm mimicking paired-pulse transcranial magnetic stimulation

Jane H L Chan et al. J Physiol. .

Abstract

A peripheral nerve model was developed to determine whether changes in axonal excitability could affect the findings in studies of cortical processes using paired-pulse transcranial magnetic stimulation (TMS). The recovery of axonal excitability from a conditioning stimulus smaller than the test stimulus was qualitatively similar to that with suprathreshold conditioning stimuli. There was an initial decrease in excitability, equivalent to refractoriness at conditioning-test intervals < 4 ms, an increase in excitability, equivalent to supernormality, at intervals of 5-20 ms and a second phase of decreased excitability, equivalent to late subnormality at intervals > 30 ms. H reflex studies using conditioning stimuli below threshold for the H reflex established that these excitability changes could be faithfully translated across an excitatory synapse. Changing membrane potential by injecting polarising current altered axonal excitability in a predictable way, and produced results similar to those reported for many disease states using paired-pulse TMS. Specifically, axonal hyperpolarisation produced a smaller decrease in excitability followed by a greater increase in excitability. This study supports the view that changes in excitability of the stimulated axons should be considered before synaptic mechanisms are invoked in the interpretation of findings from paired-pulse TMS studies.


Figures
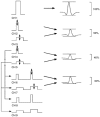
Figure 1
Figure 1. Stimulus channels
Schematic representation of the stimulus channels, which were delivered in the displayed sequence at regular intervals of 0.5 s for studies on the CNAP. On channel 1, the stimulus was supramaximal, and the resulting CNAP was used to calibrate the response on the other channels. On channels 2, 4, 6 and 8 stimulus duration was 0.1 ms and on channels 3, 5, 7 and 9 it was 1.0 ms. Channels 2 and 3 provided the unconditioned test responses, and channels 4 and 5 the conditioning stimuli. On channels 6 and 7, the conditioned potential was measured using threshold tracking and on channels 8 and 9 it was measured using amplitude tracking.
Figure 2
Figure 2. Recovery curves of median nerve for four different conditioning intensities
Mean data for six subjects, with s.e.m. only for data with 70 and 110 % conditioning stimuli. The intensity of the conditioning stimulus is expressed as a percentage of the intensity of the test stimulus, as indicated on the y-axis using arrows. Note that smaller conditioning stimuli resulted in smaller changes in the test CNAP, but that the conditioned CNAP exceeded both the conditioning and test potentials at conditioning-test intervals of 5–16 ms. (Cond: amplitude of conditioning CNAP as a percentage of the unconditioned test CNAP.)
Figure 3
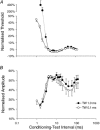
Figure 3. The recovery of axonal excitability following a single conditioning stimulus
Mean data for six subjects (± s.e.m.) for two stimulus durations (open circles: 0.1 ms; filled circles: 1.0 ms). A, results with threshold tracking, with data plotted as the change from the unconditioned threshold. An increase in threshold (i.e. a decrease in excitability) is plotted upwards. B, results with amplitude tracking showing reciprocal trends, with data expressed as a percentage of the maximal CNAP. The test CNAP was 50 % of maximum. Note the larger error bars in B. (TW: width of test stimulus.)
Figure 4
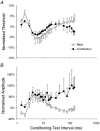
Figure 4. The recovery cycle of the H reflex following a single conditioning stimulus
Data using threshold tracking (A) and amplitude tracking (B) at rest (open circles) and during voluntary contraction (filled circles). Mean data ± s.e.m. for six subjects. Note the smaller error bars during contraction with threshold tracking. In A and B the data represent the deviation from the unconditioned value.
Figure 5
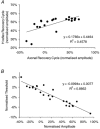
Figure 5. Changes in the H reflex in a paired-pulse paradigm
A, correlation between the change in the H reflex (data from Fig. 4B, filled circles) and the change in axonal excitability (data from Fig. 3B, open circles). B, relationship between the results of threshold and amplitude tracking of the H reflex. Data from Fig. 4A and B for the recovery cycles of the H reflex at rest.
Figure 6
Figure 6. Effects of changing membrane potential
A, effect of polarising current on the threshold for the unconditioned CNAP. The intensity of the polarising current is expressed as a percentage of the current needed to produce the unconditioned test potential. Negative values denote hyperpolarising current and positive values denote depolarising current. The threshold data (y-axis) were normalised so that the value at rest (i.e. without polarising current) was 1.0. The large open circles show unpolarised thresholds (equivalent to the resting state). B, C and D, the relationships between ‘refractoriness’ (B), ‘supernormality’ (C) and ‘late subnormality’ (D) and normalised threshold, respectively. These data were calculated as the percentage change in threshold produced by the conditioning stimulus at the appropriate conditioning-test interval (B, 2–3 ms; C, 7–8 ms; D, 40 ms; see text). Data are means ± s.e.m. Note that the error bars are often smaller than the symbols for the data, particularly in A. The labels for the y-axes in B-D appear in quotation marks because the underlying mechanisms are complicated when the conditioning stimulus is weaker than the test (see Discussion).

Similar articles

Cited by

References

    1. Awiszus F, Feistner H, Urbach D, Bostock H. Characterisation of paired-pulse transcranial magnetic stimulation conditions yielding intracortical inhibition or I-wave facilitation using a threshold-hunting paradigm. Experimental Brain Research. 1999;129:317–324. - PubMed
    1. Bostock H, Baker M. Evidence for two types of potassium channel in human motor axons in vivo. Brain Research. 1988;462:354–358. - PubMed
    1. Bostock H, Cikurel K, Burke D. Threshold tracking techniques in the study of human peripheral nerve. Muscle and Nerve. 1998;21:137–158. - PubMed
    1. Bostock H, Rothwell JC. Latent addition in motor and sensory fibres of human peripheral nerve. Journal of Physiology. 1997;498:277–294. - PMC - PubMed
    1. Brody DL, Yue DT. Release-independent short-term synaptic depression in cultured hippocampal neurons. Journal of Neuroscience. 2000;20:2480–2494. - PMC - PubMed

Publication types

LinkOut - more resources