

Prostatic intraepithelial neoplasia in genetically engineered mice
- PMID: 12163397
- PMCID: PMC1850748
- DOI: 10.1016/S0002-9440(10)64228-9
Prostatic intraepithelial neoplasia in genetically engineered mice
Abstract
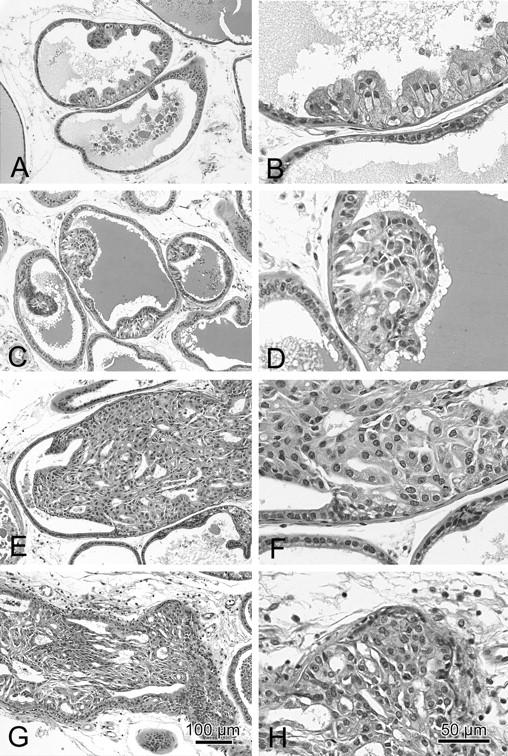
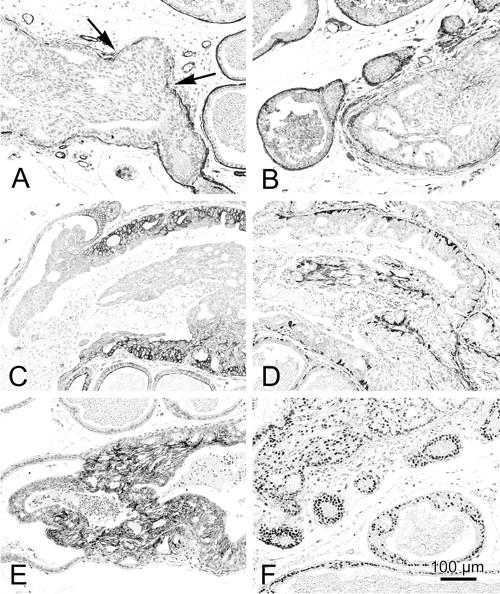
Several mouse models of human prostate cancer were studied to identify and characterize potential precursor lesions containing foci of atypical epithelial cells. These lesions exhibit a sequence of changes suggesting progressive evolution toward malignancy. Based on these observations, a grading system is proposed to classify prostatic intraepithelial neoplasia (PIN) in genetically engineered mice (GEM). Four grades of GEM PIN are proposed based on their architecture, differentiation pattern, and degree of cytological atypia. PIN I lesions have one or two layers of atypical cells. PIN II has two or more layers of atypical cells. PIN III has large, pleomorphic nuclei with prominent nucleoli and the cells tend to involve the entire lumen with expansion of the duct outlines. PIN IV lesions contain atypical cells that fill the lumen and bulge focally into, and frequently compromise, the fibromuscular sheath. Within the same cohorts, the lower grade PINs first appear earlier than the higher grades. Morphometric and immunohistochemical analyses confirm progressive change. Although the malignant potential of PIN IV in mice has not been proven, GEM PIN is similar to human PIN. This PIN classification system is a first step toward a systematic evaluation of the biological potential of these lesions in GEM.
Figures


Similar articles
-
MYC overexpression induces prostatic intraepithelial neoplasia and loss of Nkx3.1 in mouse luminal epithelial cells.PLoS One. 2010 Feb 25;5(2):e9427. doi: 10.1371/journal.pone.0009427. PLoS One. 2010. PMID: 20195545 Free PMC article.
-
Progression of prostatic intraepithelial neoplasia to invasive carcinoma in C3(1)/SV40 large T antigen transgenic mice: histopathological and molecular biological alterations.Cancer Res. 1996 Nov 1;56(21):4894-903. Cancer Res. 1996. PMID: 8895741
-
Nkx3.1; Pten mutant mice develop invasive prostate adenocarcinoma and lymph node metastases.Cancer Res. 2003 Jul 15;63(14):3886-90. Cancer Res. 2003. PMID: 12873978
-
Prostatic intraepithelial neoplasia and prostate cancer.Panminerva Med. 2002 Sep;44(3):213-20. Panminerva Med. 2002. PMID: 12094135 Review.
-
Molecular biology of prostatic intraepithelial neoplasia.Prostate. 1996 Aug;29(2):117-34. doi: 10.1002/(SICI)1097-0045(199608)29:2<117::AID-PROS7>3.0.CO;2-C. Prostate. 1996. PMID: 8700801 Review.
Cited by
-
Krüppel cripples prostate cancer: KLF6 progress and prospects.Am J Pathol. 2003 Apr;162(4):1047-52. doi: 10.1016/S0002-9440(10)63901-6. Am J Pathol. 2003. PMID: 12651597 Free PMC article. Review. No abstract available.
-
Genetically Engineered Mouse Models of Prostate Cancer in the Postgenomic Era.Cold Spring Harb Perspect Med. 2019 Feb 1;9(2):a030528. doi: 10.1101/cshperspect.a030528. Cold Spring Harb Perspect Med. 2019. PMID: 29661807 Free PMC article. Review.
-
Immune mechanisms shape the clonal landscape during early progression of prostate cancer.Dev Cell. 2023 Jun 19;58(12):1071-1086.e8. doi: 10.1016/j.devcel.2023.04.010. Epub 2023 May 5. Dev Cell. 2023. PMID: 37148881 Free PMC article.
-
Deletion of atbf1/zfhx3 in mouse prostate causes neoplastic lesions, likely by attenuation of membrane and secretory proteins and multiple signaling pathways.Neoplasia. 2014 May;16(5):377-89. doi: 10.1016/j.neo.2014.05.001. Epub 2014 Jun 14. Neoplasia. 2014. PMID: 24934715 Free PMC article.
-
Initiation of prostate cancer in mice by Tp53R270H: evidence for an alternative molecular progression.Dis Model Mech. 2012 Nov;5(6):914-20. doi: 10.1242/dmm.008995. Epub 2012 Apr 12. Dis Model Mech. 2012. PMID: 22563073 Free PMC article.
References
-
- Coffey DS: Prostate cancer. An overview of an increasing dilemma. Cancer 1993, 71:880-886 - PubMed
-
- Gopalkrishnan RV, Kang DC, Fisher PB: Molecular markers and determinants of prostate cancer metastasis. J Cell Physiol 2001, 189:245-256 - PubMed
-
- Abate-Shen C, Shen MM: Molecular genetics of prostate cancer. Genes Dev 2000, 14:2410-2434 - PubMed
-
- Castrillon DH, DePinho RA: Modeling prostate cancer in the mouse. Adv Cancer Res 2001, 82:187-204 - PubMed
-
- Huss WJ, Hanrahan CF, Barrios RJ, Simons JW, Greenberg NM: Angiogenesis and prostate cancer: identification of a molecular progression switch. Cancer Res 2001, 61:2736-2743 - PubMed
Publication types
MeSH terms
Substances
Grants and funding
LinkOut - more resources
Full Text Sources
Other Literature Sources
Medical
Molecular Biology Databases
Research Materials
