. 2002 Sep;76(17):8757-68.
doi: 10.1128/jvi.76.17.8757-8768.2002.

Clustering patterns of cytotoxic T-lymphocyte epitopes in human immunodeficiency virus type 1 (HIV-1) proteins reveal imprints of immune evasion on HIV-1 global variation

Affiliations

Clustering patterns of cytotoxic T-lymphocyte epitopes in human immunodeficiency virus type 1 (HIV-1) proteins reveal imprints of immune evasion on HIV-1 global variation

Karina Yusim et al. J Virol. 2002 Sep.

Abstract

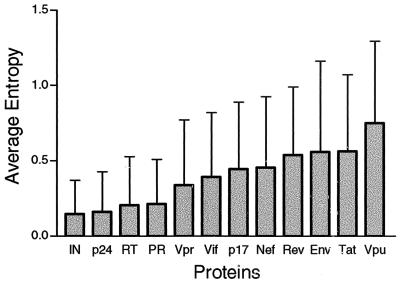
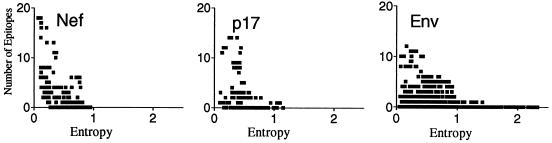
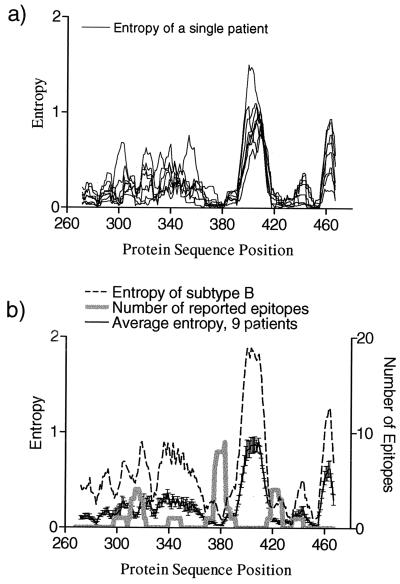
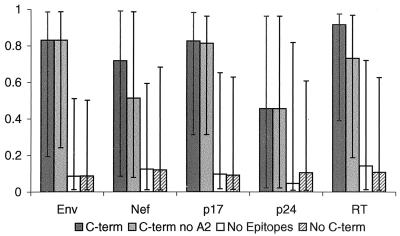
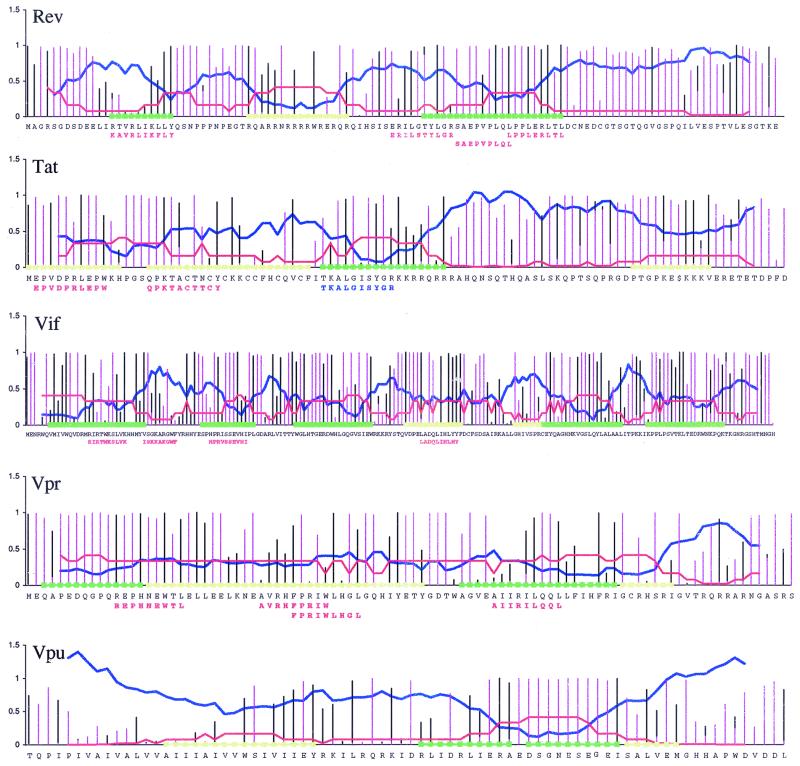
The human cytotoxic T-lymphocyte (CTL) response to human immunodeficiency virus type 1 (HIV-1) has been intensely studied, and hundreds of CTL epitopes have been experimentally defined, published, and compiled in the HIV Molecular Immunology Database. Maps of CTL epitopes on HIV-1 protein sequences reveal that defined epitopes tend to cluster. Here we integrate the global sequence and immunology databases to systematically explore the relationship between HIV-1 amino acid sequences and CTL epitope distributions. CTL responses to five HIV-1 proteins, Gag p17, Gag p24, reverse transcriptase (RT), Env, and Nef, have been particularly well characterized in the literature to date. Through comparing CTL epitope distributions in these five proteins to global protein sequence alignments, we identified distinct characteristics of HIV amino acid sequences that correlate with CTL epitope localization. First, experimentally defined HIV CTL epitopes are concentrated in relatively conserved regions. Second, the highly variable regions that lack epitopes bear cumulative evidence of past immune escape that may make them relatively refractive to CTLs: a paucity of predicted proteasome processing sites and an enrichment for amino acids that do not serve as C-terminal anchor residues. Finally, CTL epitopes are more highly concentrated in alpha-helical regions of proteins. Based on amino acid sequence characteristics, in a blinded fashion, we predicted regions in HIV regulatory and accessory proteins that would be likely to contain CTL epitopes; these predictions were then validated by comparison to new sets of experimentally defined epitopes in HIV-1 Rev, Tat, Vif, and Vpr.


Figures

FIG. 1.
FIG. 1.
M group protein variability. The variability was estimated by using Shannon entropy scores calculated for each position in a protein alignment (see Materials and Methods). The average entropies and standard deviations of all positions in the alignment of each of the 12 HIV proteins are shown. IN, integrase; PR, protease.
FIG. 2.
FIG. 2.
Correlation between entropy and epitope density for proteins that have been the focus of the most HIV-1 CTL studies. The plots show the numbers of defined CTL epitopes overlapping with each protein sequence position (red line; scale on the right axis) and Shannon entropy of each site in the protein alignments (black line; scale on the left axis). Protein sequence positions are given according to HXB2R sequence (accession no. K03455). The entropy data were smoothed by using a window of nine amino acids (the average size of a CTL epitope). The entropy scores for each site were calculated by using comparably diverse data sets for each protein (see Materials and Methods) and were plotted on the same scale for each protein, so that the figures can be directly compared. Spearman's correlation coefficient (r) and the P value for the correlation between number of epitopes and smoothed entropy are shown for each protein. r and P values for the correlation between the number of epitopes and nonsmoothed (raw) entropy scores are r = −0.36 and P < 0.0001 for Nef, r = −0.17 and P = 0.04 for p17, r = −0.12 and P = 0.0003 for Env, r = −0.1 and P = 0.3 for p24, and r = 0.1 and P < 0.001 for RT. Known secondary structural elements were assigned to positions based on crystal structures of each protein; gp160 was constructed by joining the structural models of gp120 and gp41, and Nef was constructed from N terminus and core Nef models. Alpha helices are blue, beta sheets are pink, and loops are left blank. Models used were as follows: Nef, 1AVV (5) and 1ZEC (6); p17, 1HIW (34); p24, 1E6J (12); gp120, 1G9M (43); gp41, 1DLB (58); RT, 1QE1 (55); and protease, 1HVK (66).
FIG. 3.
FIG. 3.
Scatter diagrams of the number of epitopes and entropy for each protein sequence position of the three most variable proteins, p17, Nef, and Env. Each point of the diagram corresponds to a protein sequence position to which two coordinates, entropy and number of epitopes, are assigned.
FIG. 4.
FIG. 4.
Variation of HIV protein sequences at the level of individual patients compared to the population. (a) Entropy scores for all positions in partial Env alignments were calculated for nine patients from the study of R. Shankarappa et al. (57). For entropy calculations each patient's protein sequences were combined into a single alignment and then aligned with the HIV database B subtype protein sequences. Protein sequence positions are given according to the HXB2R sequence (accession no. K03455). Smoothed entropies are shown. (b) Average of the individual smoothed entropies of nine patients (solid black line with error bars indicating standard errors), entropies of subtype B protein sequences taken from the HIV Sequence Database (each sequence corresponds to a different patient), and numbers of experimentally defined epitopes from HIV database overlapping with each position.
FIG. 5.
FIG. 5.
Proteasome cleavage predictions. For each protein and for each sequence in the alignment site-specific prediction scores were computed with NetChop (www.cbs.dtu.dk/Services/NetChop) (37) by using a neural network trained with HLA ligands (modeling in vivo degradation; see Materials and Methods). Then for each site of the alignment the site-specific predictions were calculated as the medians of the predictions from all protein sequences in the alignment. Site-specific predictions were then organized into four groups for each protein: group 1 (C-term), prediction scores at the sites corresponding to known C termini of experimentally defined epitopes; group 2 (C-term no A2), subset of group 1 excluding sites corresponding to C termini of HLA-A2 epitopes so we could establish that the NetChop program wasn't simply recognizing a common anchor motif; group 3, (no epitopes), predictions at all sites taken from epitope-lacking regions; group 4 (no C-term), predictions at all sites which do not serve as C termini of experimentally observed HIV epitopes. The bars in the figure show the medians of the distributions for each group for each protein. Error bars, 25th and 75th percentiles of the distributions. The nonparametric Mann-Whitney test was used to compare scores for known C-terminal positions; scores for group 1 were compared to those for groups 3 and 4, and those for group 2 were also compared with those for groups 3 and 4. For all five proteins the prediction scores for C termini of all experimentally observed HIV epitopes and for the subset excluding HLA-A2 binders were found to be statistically significantly higher than prediction scores for the epitope-lacking regions (for p24 and Nef, P = 0.002 for comparison of groups 1 and 3 and P = 0.0005 for comparison of groups 2 and 3; for p17, P = 0.002; for RT, P < 0.0001; for Env, P < 0.0001) and for positions that are not C termini of experimental epitopes (for p24 and Nef, P = 0.007 and 0.001, respectively, for comparison of groups 1 and 4 and 0.0003 for comparison of groups 2 and 4; for p17, P = 0.001; for RT, P < 0.0001; for Env, P < 0.0001). A different strategy for training NetChop to recognize cleavage sites, based on relative frequency of cleavage events in vitro observed in the yeast enolase and bovine beta-casein proteins (see Materials and Methods) rather than known epitopes, gave a statistically significant difference in the prediction scores between C-terminal positions and epitope-lacking regions for Env (P = 0.0012) and P24 (P = 0.0006) and a trend for RT (P = 0.08), but not for p17 (P = 0.67) and Nef (P = 0.67).
FIG. 6.
FIG. 6.
Predictions of regions likely to hold epitopes in regulatory and accessory proteins Rev, Tat, Vif, Vpr, and Vpu and the localization of newly defined epitopes relative to these regions. Quantitative values used to predict regions likely to contain epitopes are plotted relative to the HXB2R reference strain. (Note that HXB2R strain is shown only for orientation, and predictions are done based on alignments described in Materials and Methods.) Green, regions deemed favorable for finding CTL epitopes; yellow, regions less likely but still promising. Black bars, site-specific proteasome cleavage prediction scores calculated as for Fig. 5 (high is favorable); pink bars, proportions of unfavorable amino acids at each site of the alignment (low is favorable); blue lines, smoothed entropy (low is favorable). To estimate the likelihood of finding an epitope in a region as a function of entropy, the entropy range was divided into 10 equal intervals and the ratio of the number of epitopes that fall into each interval out of all epitopes from Nef, p17, p24, Env, and RT was calculated (red lines; high is favorable) and can be considered as an estimate of the probability of finding an epitope given the entropy. The experimental epitopes defined by M. M. Addo and M. Altfeld (Partners AIDS Research Center, Massachusetts General Hospital) are shown by red letters below strain HXB2R. A Tat peptide that is the most highly recognized peptide in Tat (no optimal epitope was available) is indicated in blue below the HXB2R reference sequence. Since our analysis cannot discriminate well between epitope-presenting and epitope-lacking regions in conserved proteins (e.g., p24), our predictions for potential epitope locations within conserved Vpr are rather wide and cover about 74% of the protein. For more-variable Vif and highly variable Tat and Rev, the regions where we anticipated finding experimental epitopes span about 54% of the proteins considered. Experimental CTL epitopes in these proteins were found in regions spanning 25% of the positions, and 82% of experimental epitope positions were in regions that we predicted would carry epitopes. The predictions for Tat, Rev, and Vif were highly significant by Fisher's exact test (P < 0.001).

References

    1. Abele, R., and R. Tampe. 1999. Function of the transport complex TAP in cellular immune recognition. Biochim. Biophys. Acta 1461:405-419. - PubMed
    1. Addo, M. M., M. Altfeld, E. S. Rosenberg, R. L. Eldridge, M. N. Philips, K. Habeeb, A. Khatri, C. Brander, G. K. Robbins, G. P. Mazzara, P. J. Goulder, and B. D. Walker. 2001. The HIV-1 regulatory proteins Tat and Rev are frequently targeted by cytotoxic T lymphocytes derived from HIV-1-infected individuals. Proc. Natl. Acad. Sci. USA 98:1781-1786. - PMC - PubMed
    1. Allen, T. M., D. H. O'Connor, P. Jing, J. L. Dzuris, B. R. Mothe, T. U. Vogel, E. Dunphy, M. E. Liebl, C. Emerson, N. Wilson, K. J. Kunstman, X. Wang, D. B. Allison, A. L. Hughes, R. C. Desrosiers, J. D. Altman, S. M. Wolinsky, A. Sette, and D. I. Watkins. 2000. Tat-specific cytotoxic T lymphocytes select for SIV escape variants during resolution of primary viraemia. Nature 407:386-390. - PubMed
    1. Altfeld, M., M. M. Addo, R. L. Eldridge, X. G. Yu, S. Thomas, A. Khatri, D. Strick, M. N. Phillips, G. B. Cohen, S. A. Islam, S. A. Kalams, C. Brander, P. J. Goulder, E. S. Rosenberg, and B. D. Walker. 2001. Vpr is preferentially targeted by CTL during HIV-1 infection. J. Immunol. 167:2743-2752. - PubMed
    1. Arold, S., P. Franken, M. P. Strub, F. Hoh, S. Benichou, R. Benarous, and C. Dumas. 1997. The crystal structure of HIV-1 Nef protein bound to the Fyn kinase SH3 domain suggests a role for this complex in altered T cell receptor signaling. Structure 5:1361-1372. - PubMed

Publication types

MeSH terms