. 2002 Sep;76(17):8842-54.
doi: 10.1128/jvi.76.17.8842-8854.2002.

Enhanced cytomegalovirus infection of developing brain independent of the adaptive immune system

Affiliations

Enhanced cytomegalovirus infection of developing brain independent of the adaptive immune system

Anthony N van den Pol et al. J Virol. 2002 Sep.

Abstract

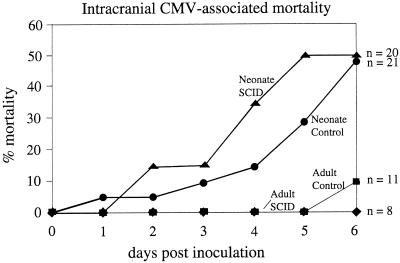
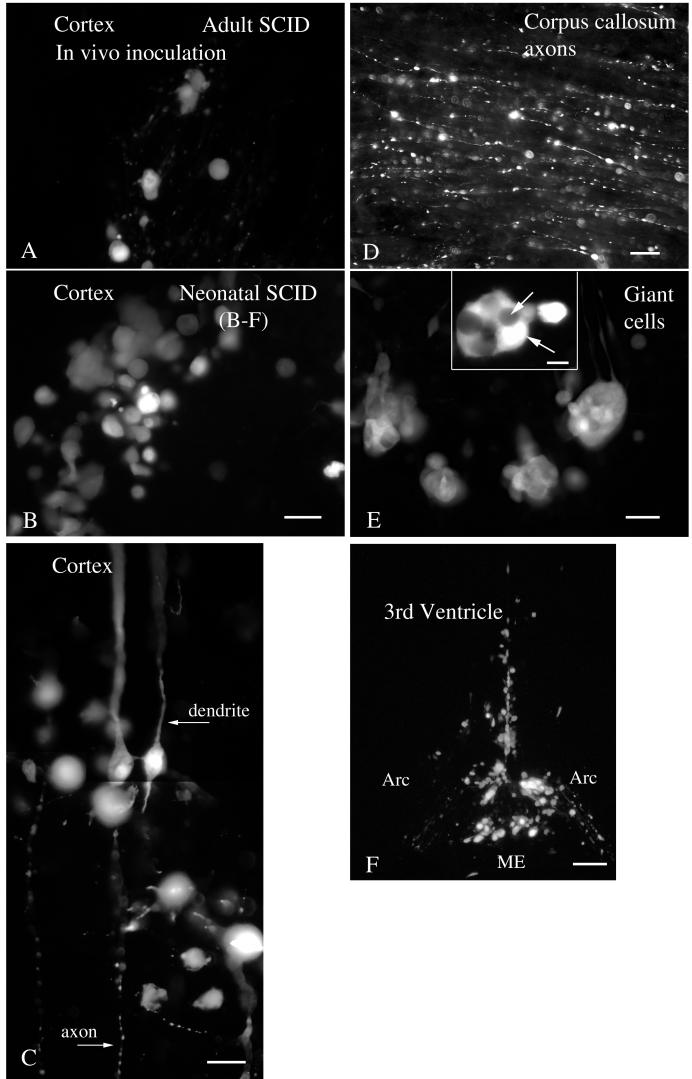
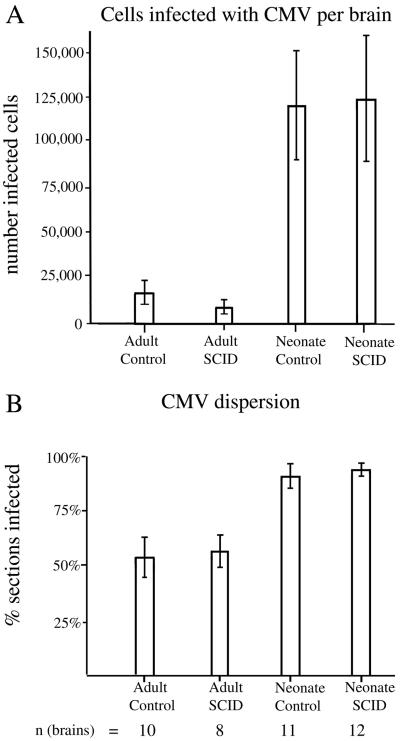
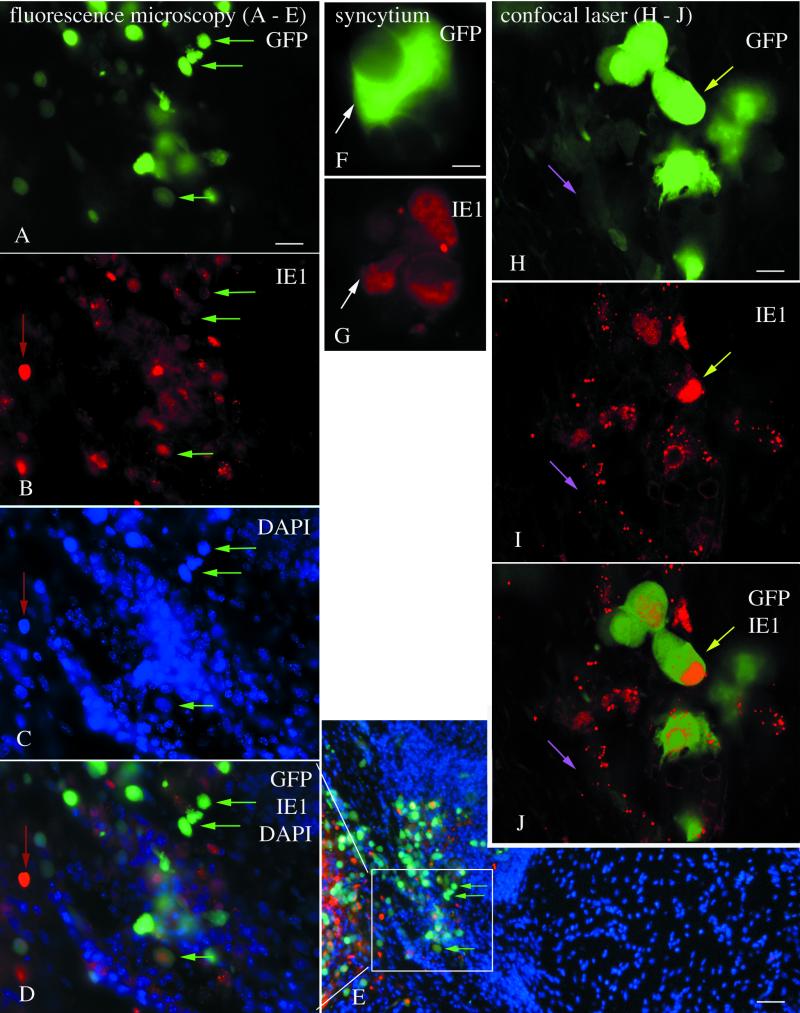
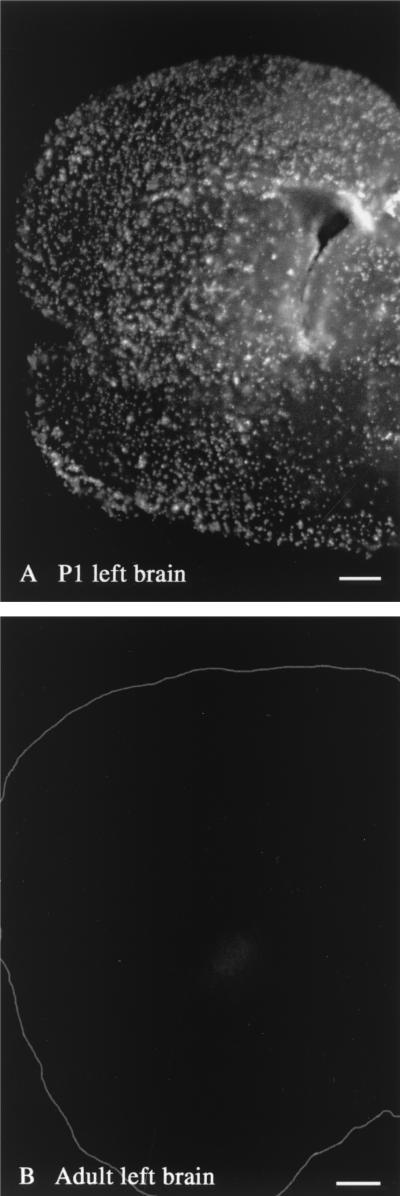
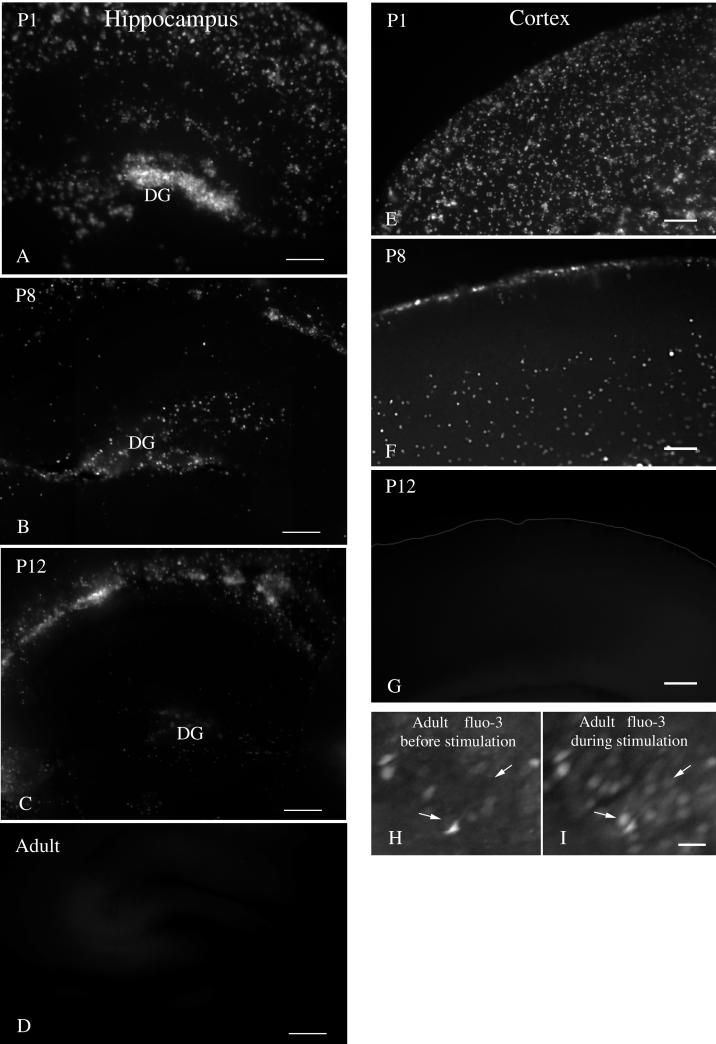
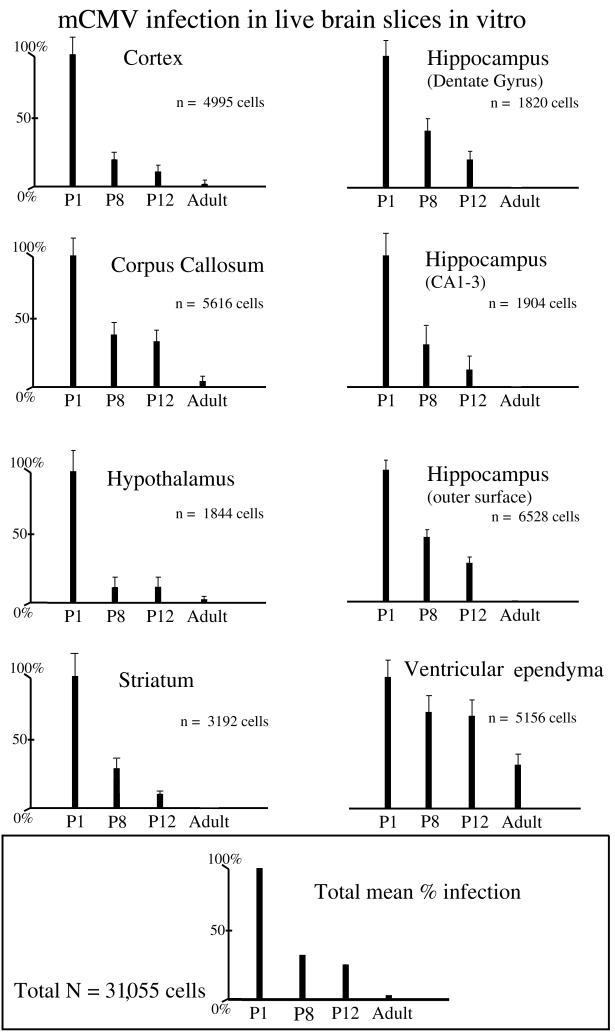
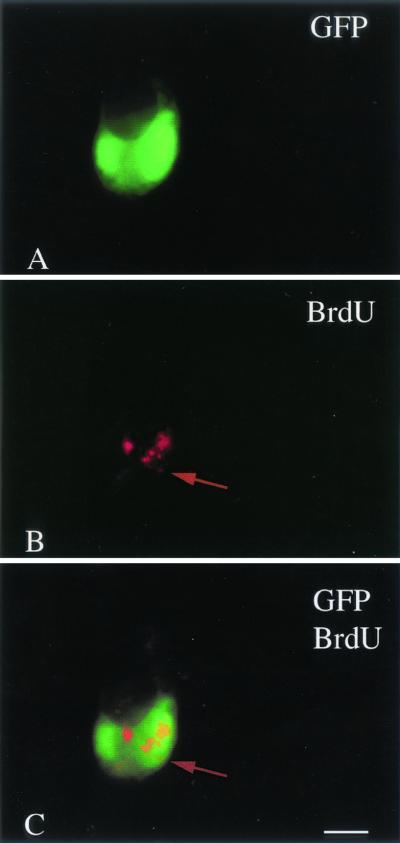
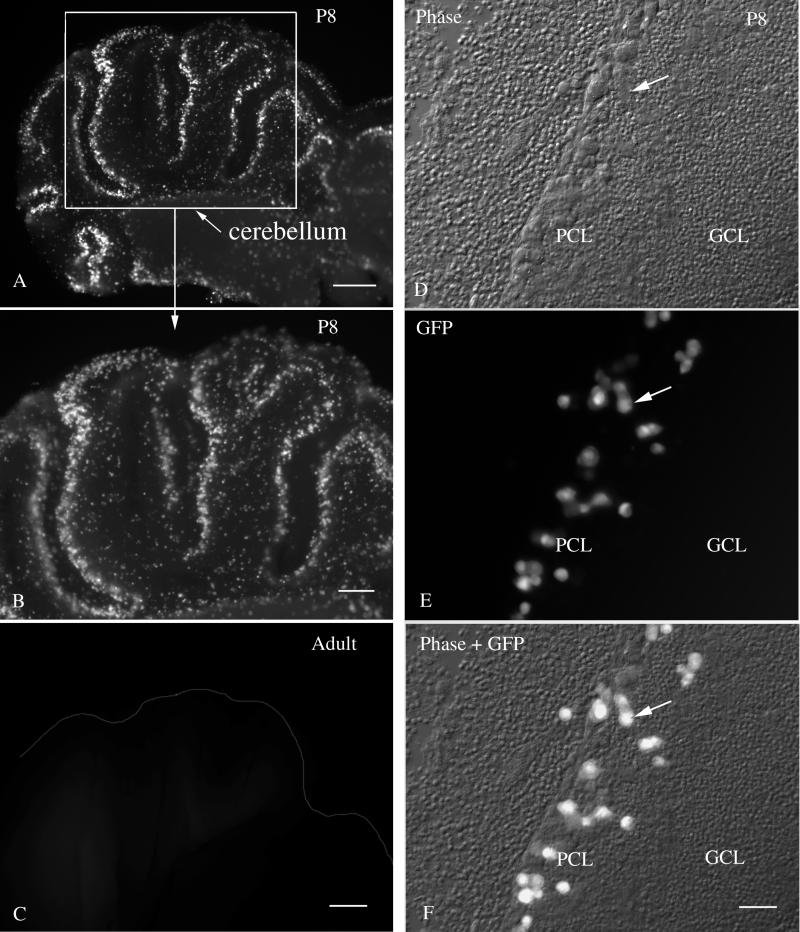
Cytomegalovirus (CMV) has been suggested as the most prevalent infectious agent causing neurological dysfunction in the developing brain; in contrast, CMV infections are rare in the adult brain. One explanation generally given for the developmental susceptibility to the virus is that the developing immune system is too immature to protect the central nervous system from viral infection, but as the immune system develops it can protect the brain. We suggest an alternate view: that developing brain cells are inherently more susceptible to CMV infection, independent of the immune system. We used a recombinant mouse CMV that leads to green fluorescent protein expression in infected cells. Control experiments demonstrated a high correlation between the number of cells detected with the viral GFP reporter gene and with immunocytochemical detection of the virus. After intracerebral inoculation, the number of CMV-infected cells in neonatal brains was many times greater than in mature control or mature immunodepressed SCID mice, and the mortality rate of neonates was substantially greater than SCID or control adults. Parallel experiments with live brain slices inoculated in vitro, done in the absence of the systemic immune system, generated similar data, with immature hippocampus, hypothalamus, cortex, striatum, and cerebellum showing substantially greater numbers of infected cells (100-fold) than found in adult slices in these same regions. Interestingly, in the cerebellar cortex, CMV-infected cells were more prevalent in the postmitotic Purkinje cell layer than in the mitotic granule cell layer, suggesting a selective infection of some cell types not dependent on cell division. Together, these data support the view that CMV has an intrinsic preference for infection of developing brain cells, independent, but not mutually exclusive, of the developmental status of the systemic immune system in controlling CMV infection.


Figures

FIG. 1.
FIG. 1.
Survival after CMV infection in adult and neonatal SCID and control mice. This graph plots the survival of the four groups of mice after CMV inoculation. Mortality was highest for both neonate groups (thick lines) compared with adults (thin lines). The number of mice per group at the beginning of the experiment is shown on the right.
FIG. 2.
FIG. 2.
CMV-infected cells in brain. (A) A small number of cells are infected by CMV in the cortex in the adult SCID mouse. (B) In contrast, a higher number was commonly found in SCID neonatal cortex. (C) Some infected cells show typical morphology of pyramidal neurons, with thickapical dendritic processes and thin axons descending toward the corpus callosum. Note the beaded morphology of the axon, typical of diseased neurons. (D) GFP-labeled axons in the corpus callosum demonstrate that neurons were infected by CMV. (E) Giant cells are commonly found in infected brains, particularly in neonatal mice. Within a single giant cell, labeling was variable, as the two white arrows indicate. (F) Infected cells are common along the ventricular ependymal cells, shown here in the ventral region of the third ventricle and median eminence (ME) in the arcuate nucleus region (Arc) of the hypothalamus. Scale bars: 20 μm in panels A and B; 15 μm in panel C; 10 μm in panel D; 10 μm (inset) and 20 μm in panel E; 50 μm in panel F.
FIG. 3.
FIG. 3.
High level of CMV infection in developing brain- in vivo experiments. (A) CMV-infected cells, identified by GFP expression, were more common in neonatal brains than in adult brains, regardless of immunocompetence. Means ± the SEM are shown. (B) The percentages of histological sections showing CMV infections were compared. SCID and control adult groups had a smaller percentage of infected sections than neonatal SCID and control brains. Means ± the SEM are shown. The total number of brains for each group are shown under each respective bar. A total of 41 brains were evaluated.
FIG. 4.
FIG. 4.
Strong correlation of GFP expression and immunocytochemical detection of CMV infection. (A to E) Fluorescence microscopy with multiple labels in CMV inoculated brains. (A) GFP-expressing cells are shown by green arrows; the same cells are indicated in succeeding micrographs to facilitate orientation within the section. (B) IE1 immunoreactivity is shown in red. A red arrow indicates a cell that shows little GFP,but strong immunostaining. The same cell is indicated in panels C and D. (C) The same field as in panels A and B reveals that many cells show no signs of infection; DAPI labels all cells blue. (D) All three colors show the relative number of cells labeled with each color. (E) A low-magnification image of the same region as panel D shows that GFP and red immunofluorescence are found in the same area, whereas to the right a large field of blue cells shows little CMV infection. (F and G) A giant cell, or syncytium of cells, expresses GFP (F) and shows red immunofluorescence (G). (H to J) Confocal scanning laser microscope images of a 1-μm optical section through an infected brain region. (H) Some cells show strong GFP expression (light green arrow), and others show relatively weak expression (pink arrow). The same regions are shown in succeeding micrographs. (I) Red immunofluorescence is strongest in the nucleus, with some granules also showing red fluorescence. (J) A strong overlap of IE1 immunostaining and GFP expression is shown here. Scale bars: 20 μm in panels A to D; 40 μm in panel E; 5 μm in panels F and G; 5 μm in panels H to J.
FIG. 5.
FIG. 5.
In vitro CMV infection of left brain in neonate and adult. (A) CMV-infected cells in an in vitro slice from the left side of a P1brain are abundant in all areas, including cortex, striatum, septum, and preoptic area. (B) In contrast, a corresponding slice from an adult brain shows almost no CMV-infected cells. The perimeter of the adult section is outlined in white. Scale bars: 350 μm in panel A; 800 μm in panel B.
FIG. 6.
FIG. 6.
Photomicrographs showing a dramatic decrease in CMV infections in brain slices with increasing age. (A to D) Coronal brain slices were made from the hippocampus at different ages and inoculated with CMV. A strong decrease in the number of infected cells was found with ages from P1, P8, P12, and adults. DG-dentate gyrus. (E to I) A similar decrease in the number of infected cells was seen in the cerebral cortex. (E) A strong level of infection is found in the developing cortex of a P1 mouse. (F) By P8, the number of cells is substantially reduced. (G) In the P12 or adult slice, no infected cells were found. (H and I) In this control experiment, cortical slices from an adult brain were labeled with fluo-3 8 h after slice preparation. Panel I shows the same region of the cortex as panel H but during stimulation. Stimulation caused an increase in cellular calcium, detected as an increase in fluorescence, demonstrating that the cells were alive. Two of many responding cells are shown by the small arrows in control (H) and stimulated (I) conditions. Scale bars: 200 μm in panel A; 150 μm in panel B; 250 μm in panel C; 250 μm in panel D; 120 μm in panels E, F, and G; 30 μm in panels H and I.
FIG. 7.
FIG. 7.
CMV infection of live brain slice in vitro. A series of eight sets of bar graphs is shown, indicating the relative number of infected cells found at each of 4 brain slice donor ages, for eight different brain regions. The number of infected cells at P1 was standardized as 100%, and the relative number of infected cells found in slices of other ages was determined. In each of the brain regions, a substantial decrease in the number of infected cells was found from P1 to adult. The total number of cells counted for each area is shown in the middle right of each bar graph. The bars indicate means ± the standard deviations. The bottom graph shows the relative mean labeling for the four different age groups when all eight brain regions are combined.
FIG. 8.
FIG. 8.
BrdU incorporation into replicating CMV. (A) A large cell in late stages of infection shows GFP expression. (B) The same cell shows punctate red immunolabeling with Texas red for BrdU, suggesting DNA replication. (C) Colocalization is shown by the overlap of the green GFP expression, together with the red BrdU immunolabeling. Scale bar: 20 μm.
FIG. 9.
FIG. 9.
CMV infection in the P8 cerebellum in vitro. (A and B) Sagittal cerebellar postnatal day 8 slices showed high levels of CMV infection in a band at the periphery of the cerebellar cortex lobules. (C) No indication of infection was found in the cerebellar slice of an adult brain. (D) In this phase-contrast micrograph, the Purkinje cell layer (PCL) and the granule cell layer (GCL) are shown. The arrow indicates a single cell found in panels d to f. (E) Large infected cells showing bright fluorescence are found selectively in the PCL and not in the GCL. (F) Fluorescent and phase images are superimposed to facilitate detection of the infected cells in a background of noninfected cells. Scale bars: 400 μm; in panel A; 200 μm in panel B; 200 μm in panel C; 30 μm in panels D, E, and F.

Similar articles

Cited by

References

    1. Abenes, G., M. Lee, E. Haghjoo, T. Tong, X. Zhan, and F. Liu. 2001. Murine cytomegalovirus open reading frame M27 plays an important role in growth and virulence in mice. J. Virol. 75:1697-1707. - PMC - PubMed
    1. Ahn, J. H., and G. S. Hayward. 1997. The major immediate-early proteins IE1 and IE2 of human cytomegalovirus colocalize with and disrupt PML-associated nuclear bodies at very early times in infected permissive cells. J. Virol. 71:4599-4613. - PMC - PubMed
    1. Alford, C. A., and W. J. Britt. 1996. Cytomegalovirus, p. 2493-2534. In B. N. Fields, D. M. Knipe, and P. M. Howley (ed.), Fields virology, 3rd ed. Lippincott-Raven Publishers, New York, N.Y.
    1. Bale, J. F., Jr, P. F. Bray, and W. E. Bell. 1985. Neuroradiographic abnormalities in congenital cytomegalovirus infection. Pediatr. Neurol. 1:42-47. - PubMed
    1. Booss, J., P. R. Dann, B. P. Griffith, and J. H. Kim. 1989. Host defense response to cytomegalovirus in the central nervous system. Am. J. Pathol. 134:71-78. - PMC - PubMed

Publication types

MeSH terms

Substances