. 2002 Sep;76(17):8855-63.
doi: 10.1128/jvi.76.17.8855-8863.2002.

Human immunodeficiency virus type 1 bound to B cells: relationship to virus replicating in CD4+ T cells and circulating in plasma

Affiliations

Human immunodeficiency virus type 1 bound to B cells: relationship to virus replicating in CD4+ T cells and circulating in plasma

Angela Malaspina et al. J Virol. 2002 Sep.

Abstract

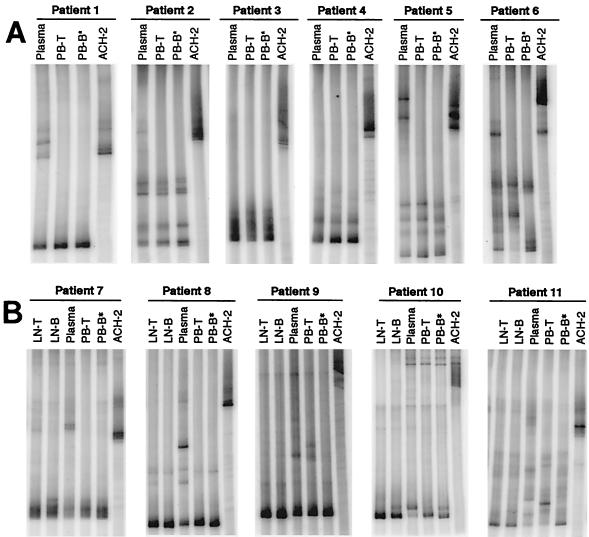
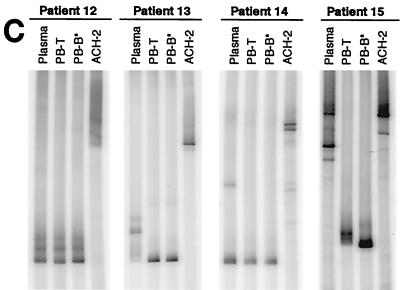
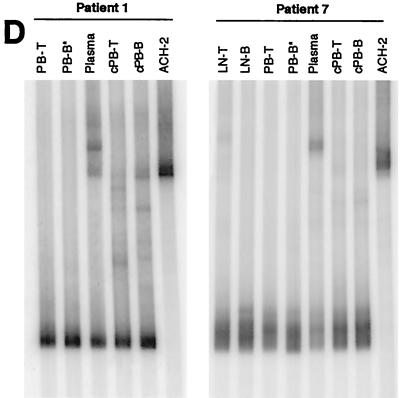
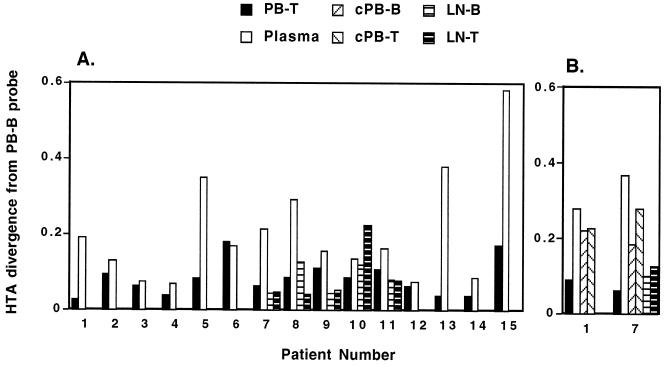
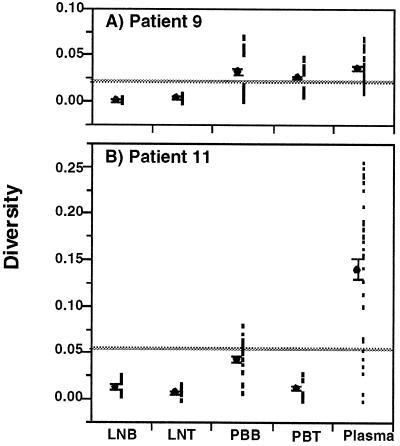
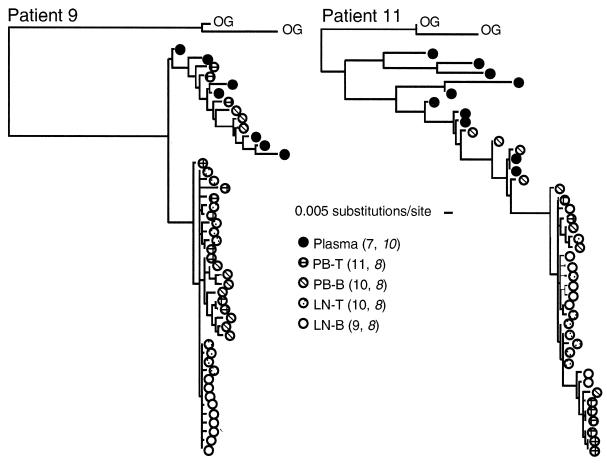
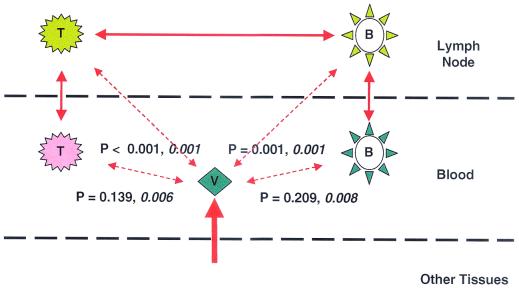
Human immunodeficiency virus type 1 (HIV-1) virions bind to B cells in the peripheral blood and lymph nodes through interactions between CD21 on B cells and complement-complexed virions. B-cell-bound virions have been shown to be highly infectious, suggesting a unique mode of HIV-1 dissemination by B cells circulating between peripheral blood and lymphoid tissues. In order to investigate the relationship between B-cell-bound HIV-1 and viruses found in CD4+ T cells and in plasma, we examined the genetic relationships of HIV-1 found in the blood and lymph nodes of chronically infected patients with heteroduplex mobility and tracking assays and DNA sequence analysis. In samples from 13 of 15 patients examined, HIV-1 variants in peripheral blood-derived B cells were closely related to virus in CD4+ T cells and more divergent from virus in plasma. In samples from five chronically viremic patients for whom analyses were extended to include lymph node-derived HIV-1 isolates, B-cell-associated HIV-1 and CD4+-T-cell-associated HIV-1 in the lymph nodes were equivalent in their divergence from virus in peripheral blood-derived B cells and generally more distantly related to virus in peripheral blood-derived CD4+ T cells. These results indicates virologic cross talk between B cells and CD4+ T cells within the microenvironment of lymphoid tissues and, to a lesser extent, between cells in lymph nodes and the peripheral blood. These findings also indicate that most of the virus in plasma originates from cells other than CD4(+) T cells in the peripheral blood and lymph nodes.


Figures

FIG. 1.
FIG. 1.
HTA of HIV-1 env sequences. Sequences (650 bp) encompassing the C2-V5 region of env were amplified from HIV-1 RNA taken from plasma and from viral supernatants derived from cocultures of PB-T and PB-B (A and C) as well as LN-T and LN-B (B). Samples were isolated from chronically viremic patients (A and B) and from recently viremic patients following discontinuation of HAART (C). HTA were extended to include HIV-1 RNA isolated directly ex vivo from PB-T and PB-B (cell associated; cPB-T and cPB-B) from patients 1 and 7 (D). PB-B-associated HIV-1 RT-PCR products were used as probes (asterisks denote probe lanes), and HIV-1 env amplified from ACH-2 cells was included as a control.
FIG. 1.
FIG. 1.
HTA of HIV-1 env sequences. Sequences (650 bp) encompassing the C2-V5 region of env were amplified from HIV-1 RNA taken from plasma and from viral supernatants derived from cocultures of PB-T and PB-B (A and C) as well as LN-T and LN-B (B). Samples were isolated from chronically viremic patients (A and B) and from recently viremic patients following discontinuation of HAART (C). HTA were extended to include HIV-1 RNA isolated directly ex vivo from PB-T and PB-B (cell associated; cPB-T and cPB-B) from patients 1 and 7 (D). PB-B-associated HIV-1 RT-PCR products were used as probes (asterisks denote probe lanes), and HIV-1 env amplified from ACH-2 cells was included as a control.
FIG. 2.
FIG. 2.
Quantitative image analysis of the HTA patterns shown in Fig. 1. As detailed in Materials and Methods, plots show the differences in band intensity distribution along each lane for a comparison of the PB-B lane to all other lanes. (A) Analysis of the HTA patterns in Fig. 1A to C. (B) Analysis of the HTA patterns in Fig. 1D.
FIG. 3.
FIG. 3.
Diversity of HIV-1 env sequences in patients 9 and 11. Sequences (650 bp) encompassing the C2-V5 region of env were amplified from HIV-1 RNA taken from plasma and from viral supernatants derived from cocultures of PB-T (PBT), PB-B (PBB), LN-T (LNT), and LN-B (LNB). Measurements were made with 7 to 11 clones per sample (see the key on Fig. 4 for the exact number of clones analyzed for each sample); the total number of points per sample represented all pairwise comparisons of sequences. ML measurements of sequence diversity (see Materials and Methods) were determined for all sequence pairs within each virus population data set and plotted (filled squares). Means (filled circles) and standard errors of the means (error bars) are also shown offset to the left of each data plot. The mean of the combined data set is indicated by the horizontal gray line. Note that the means of the virus populations in PB-B and plasma in patient 9 are similar; however, the spread of data points for the PB-B population is distinctly bimodal, indicating that it is composed of two distinct populations of virus, each of which is relatively homogeneous (see the phylogenetic tree in Fig. 4).
FIG. 4.
FIG. 4.
Phylogenetic analysis of HIV-1 in patients 9 and 11. ML phylogenetic trees (see Materials and Methods) depict the evolutionary relationships among viral sequences found in LN-B, LN-T, PB-T, PB-B, and plasma from each patient. The numbers of sequences analyzed for each sample are indicated in parentheses; those for patient 11 are shown in italic type. OG, outgroup sequences (GenBank accession numbers AF370890 and AF371037). The bar indicates substitutions per site calculated by the ML method (see Materials and Methods); hence, the calculated distances do not necessarily represent discrete integers of base substitutions.
FIG. 5.
FIG. 5.
Schematic representation of the relationships between viruses in cellular compartments and plasma from patients 9 and 11. Virus populations from each of the four cellular compartments and plasma (V) are represented schematically. Levels of relatedness between pairs of compartments, as indicated by bidirectional arrows, were determined statistically by establishing the likelihood that the two populations being compared were the same. When P values were significant (indicating that the populations being compared were significantly different) for either both patients or one of the two patients, the arrows are broken and the P values are shown (values for patient 11 are shown in italic type). The thickness of the lines represents the degree of virus trafficking suggested by the phylogenetic and statistical analyses shown. Since little of the cell-associated virus is closely related to virus in plasma, much of the virus in plasma is derived from other tissues (thickest line).

Similar articles

Cited by

References

    1. Burton, G. F., A. Masuda, S. L. Heath, B. A. Smith, J. G. Tew, and A. K. Szakal. 1997. Follicular dendritic cells (FDC) in retroviral infection: host/pathogen perspectives. Immunol. Rev. 156:185-197. - PubMed
    1. Chun, T. W., R. T. Davey, Jr., M. Ostrowski, J. Shawn Justement, D. Engel, J. I. Mullins, and A. S. Fauci. 2000. Relationship between pre-existing viral reservoirs and the re-emergence of plasma viremia after discontinuation of highly active anti-retroviral therapy. Nat. Med. 6:757-761. - PubMed
    1. Davey, R. T., Jr., N. Bhat, C. Yoder, T. W. Chun, J. A. Metcalf, R. Dewar, V. Natarajan, R. A. Lempicki, J. W. Adelsberger, K. D. Miller, J. A. Kovacs, M. A. Polis, R. E. Walker, J. Falloon, H. Masur, D. Gee, M. Baseler, D. S. Dimitrov, A. S. Fauci, and H. C. Lane. 1999. HIV-1 and T cell dynamics after interruption of highly active antiretroviral therapy (HAART) in patients with a history of sustained viral suppression. Proc. Natl. Acad. Sci. USA 96:15109-15114. - PMC - PubMed
    1. Delwart, E. L., B. Herring, A. G. Rodrigo, and J. I. Mullins. 1995. Genetic subtyping of human immunodeficiency virus using a heteroduplex mobility assay. PCR Methods Appl. 4:S202-S216. - PubMed
    1. Delwart, E. L., and C. J. Gordon. 1997. Tracking changes in HIV-1 envelope quasispecies using DNA heteroduplex analysis. Methods 12:348-354. - PubMed

Publication types

Associated data