. 2002 Aug 20;115(1-2):15-35.
doi: 10.1016/s0925-4927(02)00025-2.

Amygdala-hippocampal shape differences in schizophrenia: the application of 3D shape models to volumetric MR data

Affiliations

Amygdala-hippocampal shape differences in schizophrenia: the application of 3D shape models to volumetric MR data

Martha E Shenton et al. Psychiatry Res. .

Abstract

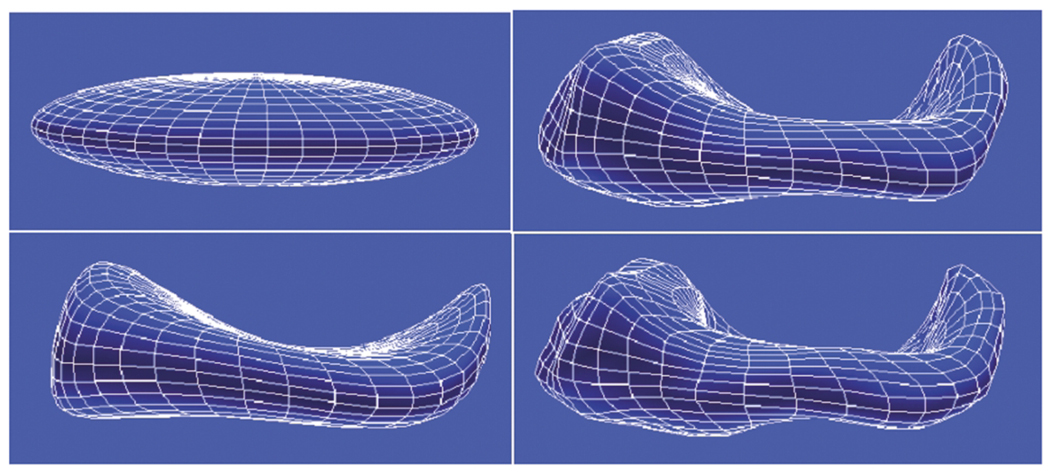
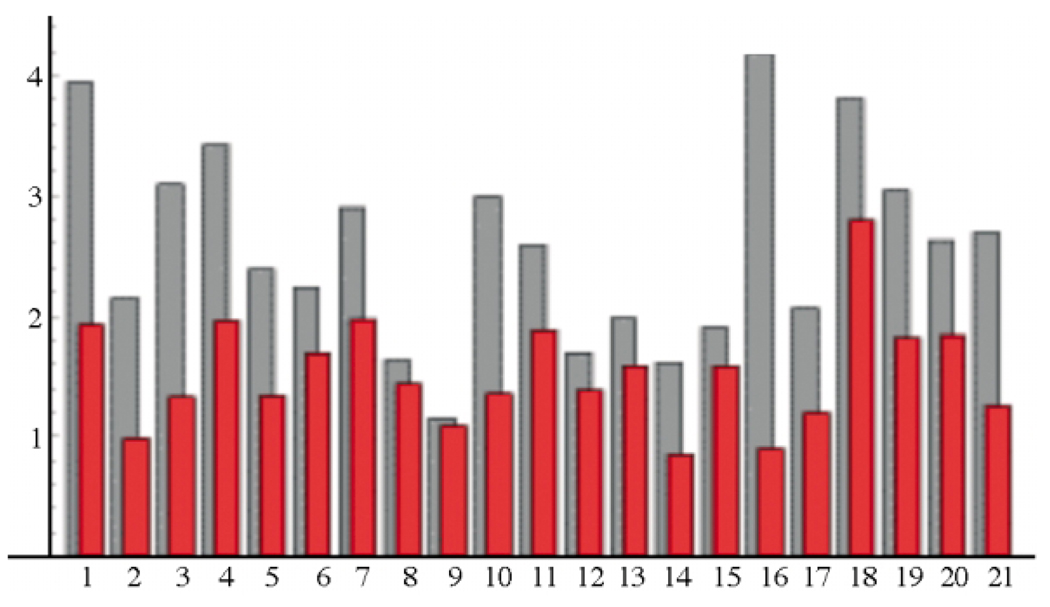
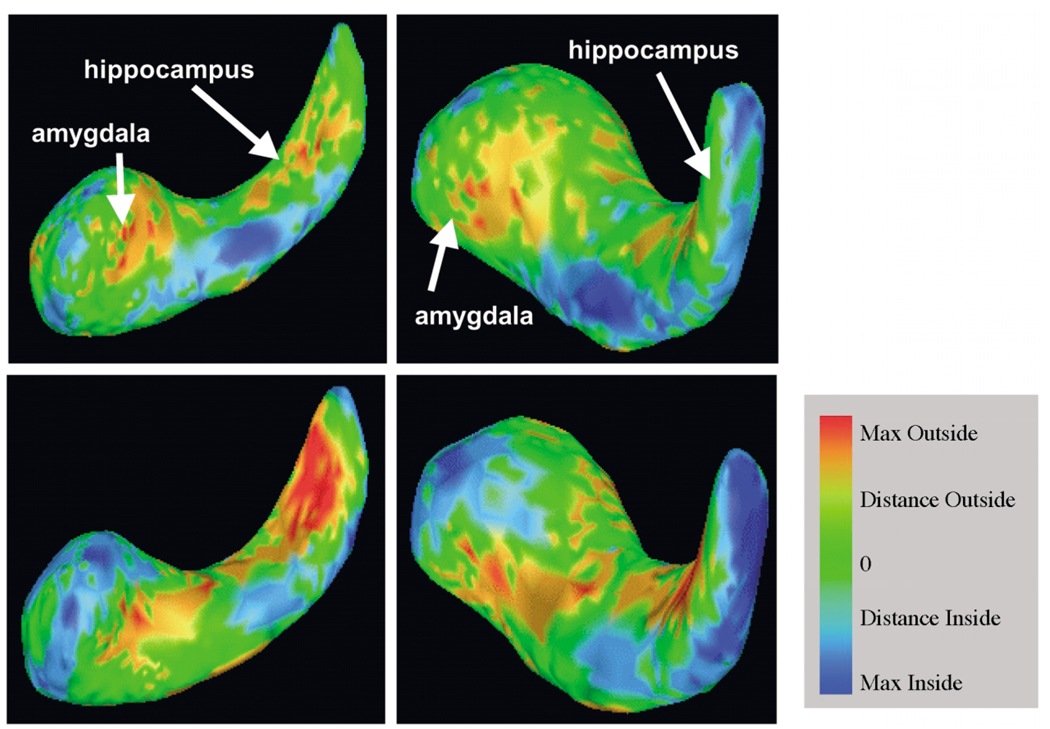
Evidence suggests that some structural brain abnormalities in schizophrenia are neurodevelopmental in origin. There is also growing evidence to suggest that shape deformations in brain structure may reflect abnormalities in neurodevelopment. While many magnetic resonance (MR) imaging studies have investigated brain area and volume measures in schizophrenia, fewer have focused on shape deformations. In this MR study we used a 3D shape representation technique, based on spherical harmonic functions, to analyze left and right amygdala-hippocampus shapes in each of 15 patients with schizophrenia and 15 healthy controls matched for age, gender, handedness and parental socioeconomic status. Left/right asymmetry was also measured for both shape and volume differences. Additionally, shape and volume measurements were combined in a composite analysis. There were no differences between groups in overall volume or shape. Left/right amygdala-hippocampal asymmetry, however, was significantly larger in patients than controls for both relative volume and shape. The local brain regions responsible for the left/right asymmetry differences in patients with schizophrenia were in the tail of the hippocampus (including both the inferior aspect adjacent to parahippocampal gyrus and the superior aspect adjacent to the lateral geniculate nucleus and more anteriorly to the cerebral peduncles) and in portions of the amygdala body (including the anterior-superior aspect adjacent to the basal nucleus). Also, in patients, increased volumetric asymmetry tended to be correlated with increased left/right shape asymmetry. Furthermore, a combined analysis of volume and shape asymmetry resulted in improved differentiation between groups. Classification function analyses correctly classified 70% of cases using volume, 73.3% using shape, and 87% using combined volume and shape measures. These findings suggest that shape provides important new information toward characterizing the pathophysiology of schizophrenia, and that combining volume and shape measures provides improved group discrimination in studies investigating brain abnormalities in schizophrenia. An evaluation of shape deformations also suggests local abnormalities in the amygdala-hippocampal complex in schizophrenia.


Figures

Fig. 1
Fig. 1
Hierarchical Fourier surface representation of the amygdala–hippocampal complex. This figure shows reconstructions up to order 1 (top left), 3 (bottom left), 7 (top right) and 12 (bottom right). Of note, more and more details are added with increasing order (i.e., from 1 to 12). The first order representation is an ellipsoid and is used for a spatial alignment of shapes by translation and rotation.
Fig. 2
Fig. 2
Automatic segmentation of 3D amygdala–hippocampal complex using surface-based model-deformation (3D Fourier snake). Figures in the left panel show the 3D initialization based on Talairach coordinates (blue contour, blue surface), and a manual rater’s segmentation (green contour, blue surface). Figures in the right panel show the resulting segmentation after 3D model deformation.
Fig. 3
Fig. 3
Shape distance measures are displayed for the segmentations of the left amygdala–hippocampal complex for 21 individuals. The plot illustrates quantitative evaluation of the shape differences for the manual slice-by-slice segmentation and the automated segmentation. The horizontal axis displays the 21 individual cases, and the vertical measurement displays the square root of the mean square distance in millimeters between the surfaces of the 3D object pairs. The light gray bars represent the shape distance at model initialization, and the dark red bars represent the shape distance after model-based segmentation by elastic model deformation.
Fig. 4
Fig. 4
Correlation between manual and model-based 3D segmentation of the left and right amygdala–hippocampal complex for 21 subjects. The correlation coefficient for the volumetric results is 0.98.
Fig. 5
Fig. 5
Statistics of L/R volume index (upper left panel), L/R shape index (upper right panel), and a combined two-dimensional feature space (bottom panel) with volume index (horizontal axis ) and shape index (vertical axis ). The ellipsoids represent the quantiles of the two-dimensional distributions for controls (black triangles) and for the schizophrenics (open squares). The two-dimensional plot demonstrates the improved group discrimination obtained by combining the two features.
Fig. 6
Fig. 6
A graphical visualization is presented for the left/right asymmetry of the amygdala–hippocampal complex for healthy controls (top row) and patients with schizophrenia (bottom row). The left and right columns show sagittal and posterior–anterior viewing directions (i.e., viewing from the tail of the hippocampus). The color figures display group averages of individual pairwise left/right difference calculations. These averages are obtained by mirroring the right shapes to the left, and then overlaying the individual pairs of the amygdala–hippocampus surfaces. Shapes were uniformly scaled for normalized volumes as described in the text. Signed local surface distances are mapped onto the reference shape as color, ranging from dark blue (maximum inside) to red (maximum outside). At dark blue locations, the right object surface is inside with respect to the left object, whereas at locations of red regions, the right object is outside. Green signifies perfect overlap. The color range is adjusted to plus/minus 1.4 mm for maximum inside and outside. A comparison between the healthy control group (top row) and schizophrenic group (bottom row) illustrates that the major local regions responsible for the shape difference are the tail and portions of the amygdala body. The maximum surface distances for healthy controls and for schizophrenics were 1.3 and 2.1 mm, respectively. Please note that the colors do not indicate significance by P-value but instead they indicate the magnitude of inside–outside distance between group means. The figures are intended to give preliminary insight into the nature and localization of the quantitative shape asymmetry as described in this article.

References

    1. American Psychiatric Association on Nomenclature and Statistics. Diagnostic and Statistical Manual of Mental Disorders, revised. 3rd edition. Washington, DC: American Psychiatric Association; 1987.
    1. Andreasen NC. Scale for the Assessment of Negative Symptoms (SANS) Iowa City: University of Iowa College of Medicine; 1981.
    1. Andreasen NC. Scale for the Assessment of Positive Symptoms (SAPS) Iowa City: University of Iowa College of Medicine; 1984.
    1. Andreasen NC, Flashman L, Flaum M, Arndt S, Swayze V, II, O’Leary DS, Ehrhardt JC, Yuh WTC. Regional brain abnormalities in schizophrenia measured with magnetic resonance imaging. JAMA. 1994;272:1763–1769. - PubMed
    1. Angenent S, Haker S, Tannenbaum A, Kikinis R. On the Laplace–Beltrami operator and brain surface flattening. IEEE Transactions on Medical Imaging. 1999;18:700–711. - PubMed

Publication types