. 2002 Aug 20;99(17):11175-80.
doi: 10.1073/pnas.162268099. Epub 2002 Aug 6.

The ensemble folding kinetics of protein G from an all-atom Monte Carlo simulation

Affiliations

The ensemble folding kinetics of protein G from an all-atom Monte Carlo simulation

Jun Shimada et al. Proc Natl Acad Sci U S A. .

Abstract

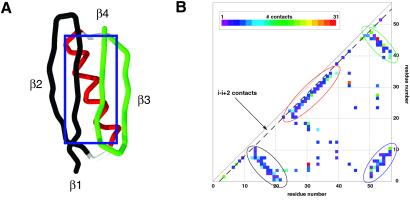
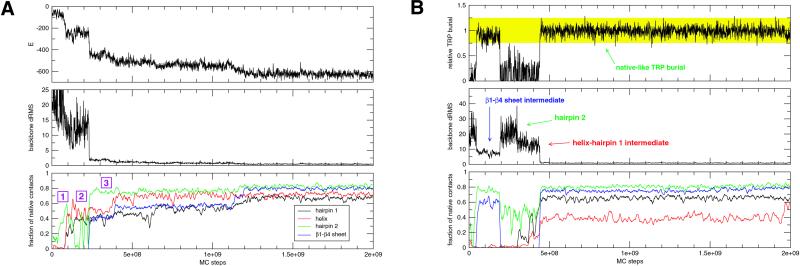
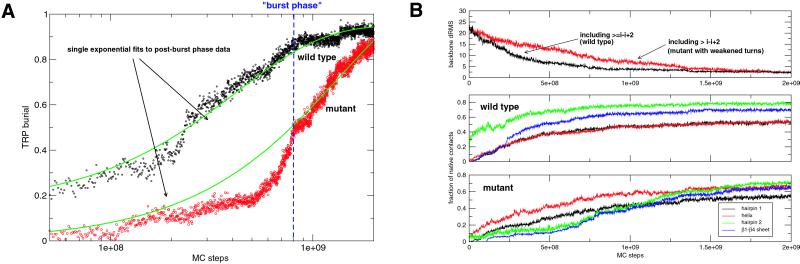
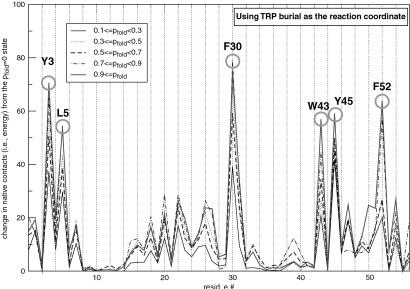
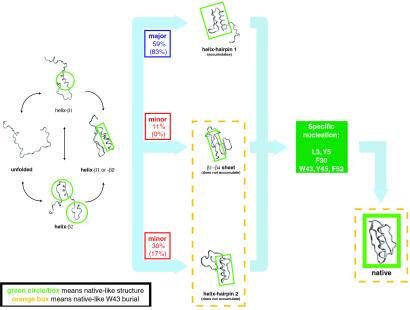
Protein G is folded with an all-atom Monte Carlo simulation by using a Gō potential. When folding is monitored by using burial of the lone tryptophan in protein G as the reaction coordinate, the ensemble kinetics is single exponential. Other experimental observations, such as the burst phase and mutational data, are also reproduced. However, more detailed analysis reveals that folding occurs over three distinct, three-state pathways. We show that, because of this tryptophan's asymmetric location in the tertiary fold, its burial (i) does not detect certain intermediates and (ii) may not correspond to the folding event. This finding demonstrates that ensemble averaging can disguise the presence of multiple pathways and intermediates when a non-ideal reaction coordinate is used. Finally, all observed folding pathways eventually converge to a common rate-limiting step, which is the formation of a specific nucleus involving hydrophobic core residues. These residues are conserved in the ubiquitin superfamily and in a phage display experiment, suggesting that fold topology is a strong determinant of the transition state.


Figures

Fig 1.
Fig 1.
(A) The 57-residue protein G and (B) its contact matrix. The protein (PDB code ) features two anti-parallel β hairpins [N-terminal (colored in black; residues 0–20) and C-terminal (green; 42–55)] packed against a central helix (red; 23–36). The β1 and β4 strands also form a parallel β-sheet. In the contact matrix, a colored square at position (i, j) indicates the number of contact made between residue i and j. The contacts contributing to each of the major secondary structure elements are circled according to the color scheme in A. The i − (i + 2) contacts lie along the dotted line.
Fig 2.
Fig 2.
(A) A typical “fast-folding” trajectory, which passes through the helix-hairpin 1 (major) intermediate. Folding occurs to less than 1 Å drms. In this particular trajectory, hairpin 2 folds and unfolds independently (labeled by a purple “1” in the Bottom panel), until the helix-hairpin 1 complex folds (“2”) and stabilizes hairpin 2 (“3”). Note that kinetic traps are not encountered. (B) A trajectory monitored by tryptophan burial. The Top panel tracks the burial of tryptophan 43 (W43) relative to the native state for a typical trajectory. Relative burial is computed as follows: (total number of contacts made by W43)/(total number of native contacts made by W43). Significant events encountered in this trajectory are labeled.
Fig 3.
Fig 3.
Ensemble wild-type and hairpin 2 mutant kinetics as seen from different reaction coordinates. (A) W43 burial. The end of the burst phase (labeled as “burst phase”) was determined by matching the wild-type W43 burial with the burst phase value reported in ref. . The wild-type and mutant post-burst-phase data were fitted with single exponential rates of 2.56 × 10⁻⁹ and 9.51 × 10⁻¹⁰, respectively. (B) Backbone drms, and secondary structure details. The wild-type ensemble settles to low drms faster than the mutant ensemble (Top). Under ensemble averaging, the wild-type hairpin 2 appears to form earlier than the other three secondary structure features (Middle), whereas this sequence is reversed in the mutant (Bottom).
Fig 4.
Fig 4.
Qualitative free energy landscapes. All wild-type runs were histogrammed to compute the normalized probability p(X, Y) as a function of the reaction coordinates X and Y. These probabilities were then converted to an effective free energy via the relation Feff ∼ −ln P. The free energies are given relative to the unfolded state. Although not an exact calculation, it gives a rough idea of where the minima and the saddle regions are located. When drms and energy are the reaction coordinates (Left), there are three distinct minima: unfolded, intermediate, and the native states. In contrast, when drms and W43 burial are used (Right), only two distinct minima (buried and exposed) are seen.
Fig 5.
Fig 5.
Complex time evolution of intermediate populations. The wild-type and mutant fractional populations were fit with a kinetic model featuring multiple three-state pathways [unfolded → I1 (helix-hairpin 1) or I2 (helix-hairpin 2) or I3 (β1-β4 sheet) → N]. The model fitting was done in the following manner: (i) a single exponential was first fitted to the unfolded population data; (ii) the observed pathway branching ratios were then used to determine the three U → I1 or I2 or I3 rates; and (iii) the I1, I2, and I3 population curves were then each separately fitted to determine the I1, I2, and I3 → N rates. For the wild type, the fit is very good for the first billion MC steps, but systematic deviation is observed afterward. This result is best explained by the presence of low-energy sidechain packing traps (7), which results in slower, non-exponential relaxation of the unfolded state. The fit of the model for the mutant was worse overall. We did not find a straightforward explanation for this finding, and we thus attribute it to statistical error. For wild type, kUI1 = 1.56 × 10⁻⁹, kUI2 = 7.91 × 10⁻¹⁰, kUI3 = 2.90 × 10⁻¹⁰, kI1F =7.56 × 10⁻⁹, kI2U =1.09 × 10⁻⁸, kI3F =1.55 × 10⁻⁹; for the mutant: kUI1 = 8.63 × 10⁻¹⁰, kUI2 = 1.82 × 10⁻¹⁰, kI1F =6.71 × 10⁻⁹, and kI2F =1.33 × 10⁻⁸.
Fig 6.
Fig 6.
Characterization of the transition state ensemble. For each trajectory, the five structures closest to the transition state (i.e., that have a probability to fold (pfold) = 0.5) were collected and then partitioned into groups having a certain pfold range. Here, the total number of native contacts made by a particular residue from an average member in each group (relative to the pfold = 0 state) is plotted. In other words, a rising peak as pfold increases from 0 to 1, such as F30, suggests a residue that participates in the transition state. Because the number of native contacts is proportional to energy, the height of the peak corresponds to the energetic importance of a residue to the transition state. In this particular plot, W43 burial was used as the reaction coordinate to monitor folding, to mimic the protocol used in ref. . The results did not change when energy and drms were used as the reaction coordinates. Similar nucleus residues were obtained when this analysis was repeated for the mutant trajectories.
Fig 7.
Fig 7.
Summary of the folding kinetics. The observed folding pathways, with their branching ratios, are illustrated. The ratios for the mutant are indicated in parentheses. For each structure, the native-like features are circled or boxed in green. Just before entering two of the three pathways (i.e., the helix-hairpin 1 and helix-hairpin 2 pathways), the helix forms as a result of stabilization by contacts with the β1 or β2 strand (labeled “helix-β1 or -β2”). As expected from its marginal stability (see Simulation Method), helix formation is initiated only when it makes contacts with the strands. After formation of the intermediate, all three pathways converge to a common rate-limiting step, which is the formation of the specific nucleus. Structures exhibiting native-like W43 burial are enclosed in a dotted orange box.

References

    1. Duan Y. & Kollman, P. (1998) Science 282, 740-743. - PubMed
    1. Jackson S. E. (1998) Folding Des. 3, R81-R91. - PubMed
    1. Sheinerman F. B. & Brooks, C. L., III (1998) J. Mol. Biol. 278, 439-455. - PubMed
    1. Fersht A. R. & Daggett, V. (2002) Cell 108, 573-582. - PubMed
    1. Shirts M. R & Pande, V. S. (2001) Phys. Rev. Lett. 86, 4983-4987. - PubMed

Publication types