Comparative Study
. 2002 Jun;21(6):646-52.
doi: 10.1109/TMI.2002.800585.

Regional lung perfusion as determined by electrical impedance tomography in comparison with electron beam CT imaging

Affiliations
Comparative Study

Regional lung perfusion as determined by electrical impedance tomography in comparison with electron beam CT imaging

Inéz Frerichs et al. IEEE Trans Med Imaging. 2002 Jun.

Abstract

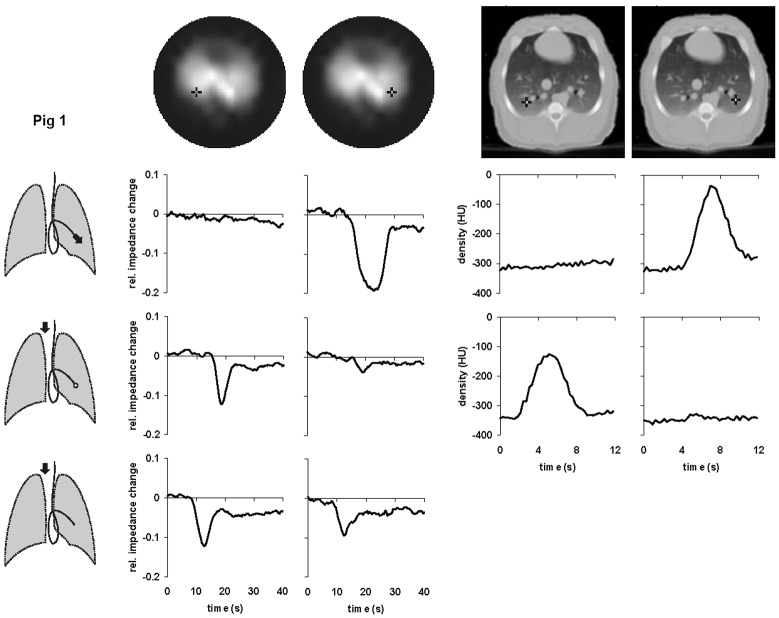
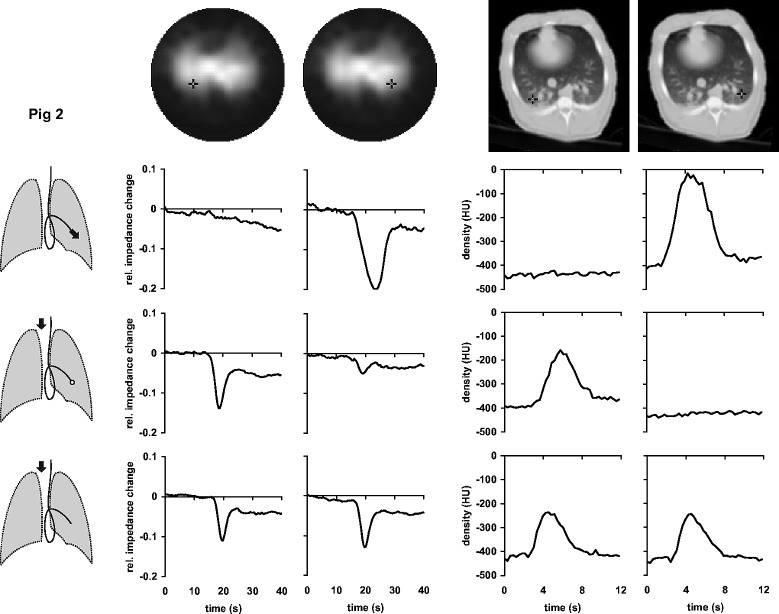
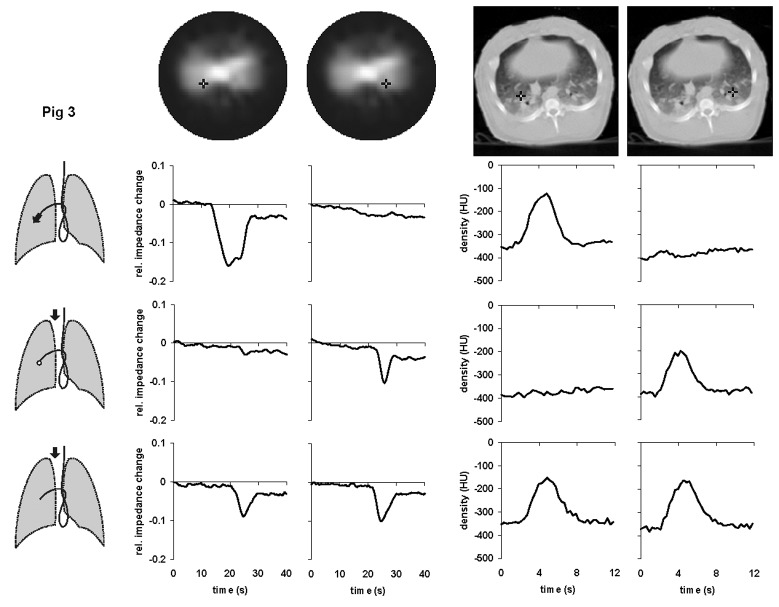
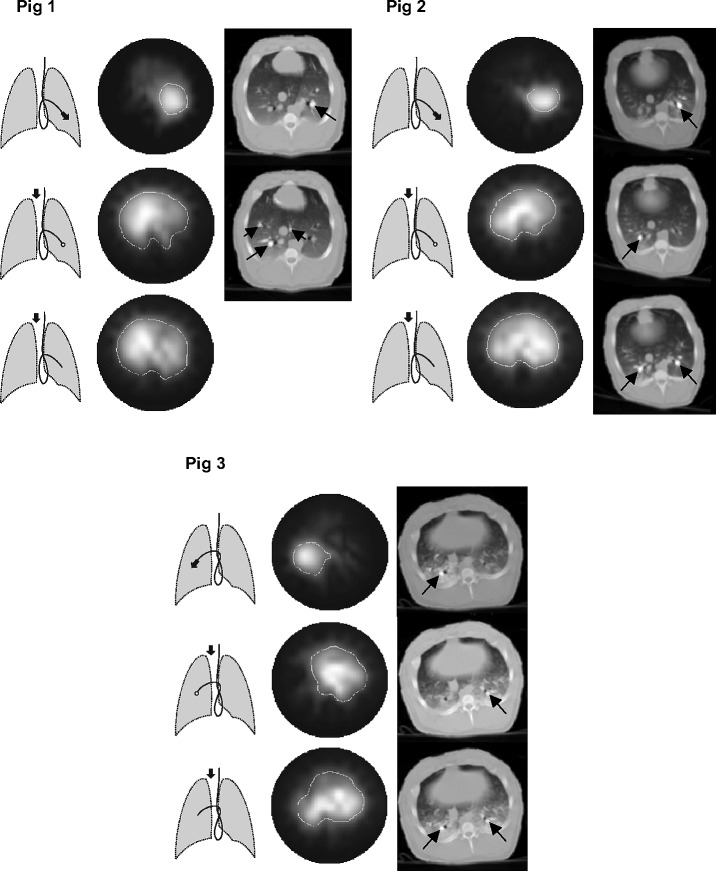
The aim of the experiments was to check the feasibility of pulmonary perfusion imaging by functional electrical impedance tomography (EIT) and to compare the EIT findings with electron beam computed tomography (EBCT) scans. In three pigs, a Swan-Ganz catheter was positioned in a pulmonary artery branch and hypertonic saline solution or a radiographic contrast agent were administered as boli through the distal or proximal openings of the catheter. During the administration through the proximal opening, the balloon at the tip of the catheter was either deflated or inflated. The latter case represented a perfusion defect. The series of EIT scans of the momentary distribution of electrical impedance within the chest were obtained during each saline bolus administration at a rate of 13/s. EBCT scans were acquired at a rate of 3.3/s during bolus administrations of the radiopaque contrast material under the same steady-state conditions. The EIT data were used to generate local time-impedance curves and functional EIT images showing the perfusion of a small lung region, both lungs with a perfusion defect and complete both lungs during bolus administration through the distal and proximal catheter opening with an inflated or deflated balloon, respectively. The results indicate that EIT imaging of lung perfusion is feasible when an electrical impedance contrast agent is used.


Figures

Fig. 1.
Fig. 1.. Local time-impedance (six left-hand diagrams) and time-density curves (four right-hand diagrams) in pig 1 during bolus administration of the hypertonic saline solution and the radiographic contrast material, respectively. The black crosses in the dorsal regions of the right and left lungs in the functional EIT images of lung ventilation and in the EBCT images (top) indicate the pixel locations at which the data were obtained. Three drawings of the lungs show schematically the position of the Swan-Ganz catheter in a branch of the left pulmonary artery and the bolus administration sites (black arrows). The bolus was administered either through the distal (upper drawing) or the proximal opening of the catheter with the balloon at the tip of the catheter being inflated (middle drawing) or deflated (lower drawing). The EBCT measurements during the central venous bolus administration with deflated balloon were not performed in this animal.
Fig. 2.
Fig. 2.. Local time-impedance (six left-hand diagrams) and time-density curves (six right-hand diagrams) in pig 2 during bolus administration of the hypertonic saline solution and the radiographic contrast material, respectively. The black crosses in the dorsal regions of the right and left lungs in the functional EIT images of lung ventilation and in the EBCT images (top) indicate the pixel locations at which the data were obtained. Three drawings of the lungs show schematically the position of the Swan-Ganz catheter in a branch of the left pulmonary artery and the bolus administration sites (black arrows). The bolus was administered either through the distal (upper drawing) or the proximal opening of the catheter with the balloon at the tip of the catheter being inflated (middle drawing) or deflated (lower drawing).
Fig. 3.
Fig. 3.. Local time-impedance (six left-hand diagrams) and time-density curves (six right-hand diagrams) in pig 3 during bolus administration of the hypertonic saline solution and the radiographic contrast material, respectively. The black crosses in the dorsal regions of the right and left lungs in the functional EIT images of lung ventilation and in the EBCT images (top) indicate the pixel locations at which the data were obtained. Three drawings of the lungs show schematically the position of the Swan-Ganz catheter in a branch of the right pulmonary artery and the bolus administration sites (black arrows). The bolus was administered either through the distal (upper drawing) or the proximal opening of the catheter with the balloon at the tip of the catheter being inflated (middle drawing) or deflated (lower drawing).
Fig. 4.
Fig. 4.. Functional EIT images showing the regional blood flow in three pigs during administration of the hyper-tonic saline solution at different administration sites (see the schematic drawings of lungs next to the EIT images). The EIT images show in light tones those regions in the thoracic cross section where a fall of electrical impedance was observed during administration of a saline bolus. The EBCT scans show the respective chest cross sections at the moment of appearance of the contrast enhancement in the pulmonary arterial system (black arrows) during bolus administration at the sites indicated by the drawings of lungs and corresponding with the EIT measurements.

References

    1. Eyüboglu B. M., Brown B. H., Barber D. C. and Seagar A. D., “Localization of cardiac related impedance changes in the thorax,” Clin. Phys. Physiol. Meas., pp. 167–173, vol. 8, 1987. - PubMed
    1. Frerichs I., “Electrical impedance tomography (EIT) in applications related to lung and ventilation: a review of experimental and clinical activities,” Physiol. Meas., pp. R1–R21, vol. 21, 2000. - PubMed
    1. McArdle F. J., Suggett A. J., Brown B. H. and Barber D. C., “An assessment of dynamic images by applied potential tomography for monitoring pulmonary perfusion,” Clin. Phys. Physiol. Meas., pp. 87–91, vol. 9, 1988. - PubMed
    1. Leathard A., Brown B. H., Campbell J., Zhang F., Morice A. H. and Tayler D., “A comparison of ventilatory and cardiac related changes in EIT images of normal human lungs and of lungs with pulmonary emboli,” Physiol. Meas., pp. A137–A146, vol. 15, 1994. - PubMed
    1. Zadehkoochak M., Blott B. H., Hames T. K. and George R. F., “Pulmonary perfusion and ventricular ejection imaging by frequency domain filtering of EIT images,” Clin. Phys. Physiol. Meas., pp. 191–196, vol. 13, 1992. - PubMed

Publication types