Neuronal activation of brain vagal-regulatory pathways and upper gut enteric plexuses by insulin hypoglycemia
- PMID: 12169436
- PMCID: PMC8091863
- DOI: 10.1152/ajpendo.00538.2001
Neuronal activation of brain vagal-regulatory pathways and upper gut enteric plexuses by insulin hypoglycemia
Abstract
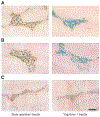
Neuronal activation of brain vagal-regulatory nuclei and gastric/duodenal enteric plexuses in response to insulin (2 U/kg, 2 h) hypoglycemia was studied in rats. Insulin hypoglycemia significantly induced Fos expression in the paraventricular nucleus of the hypothalamus, locus coeruleus, dorsal motor nucleus of the vagus (DMN), and nucleus tractus solitarii (NTS), as well as in the gastric/duodenal myenteric/submucosal plexuses. A substantial number of insulin hypoglycemia-activated DMN and NTS neurons were choline acetyltransferase and tyrosine hydroxylase positive, respectively, whereas the activated enteric neurons included NADPH- and vasoactive intestinal peptide neurons. The numbers of Fos-positive cells in each above-named brain nucleus or in the gastric/duodenal myenteric plexus of insulin-treated rats were negatively correlated with serum glucose levels and significantly increased when glucose levels were lower than 80 mg/dl. Acute bilateral cervical vagotomy did not influence insulin hypoglycemia-induced Fos induction in the brain vagal-regulatory nuclei but completely and partially prevented this response in the gastric and duodenal enteric plexuses, respectively. These results revealed that brain-gut neurons regulating vagal outflow to the stomach/duodenum are sensitively responsive to insulin hypoglycemia.
Figures


Similar articles
-
Vagal-enteric interface: vagal activation-induced expression of c-Fos and p-CREB in neurons of the upper gastrointestinal tract and pancreas.Anat Rec. 2001 Jan 1;262(1):29-40. doi: 10.1002/1097-0185(20010101)262:1<29::AID-AR1008>3.0.CO;2-B. Anat Rec. 2001. PMID: 11146426
-
Reduced CCK-induced Fos expression in the hindbrain, nodose ganglia, and enteric neurons of rats lacking CCK-1 receptors.Brain Res. 2005 Jul 27;1051(1-2):155-63. doi: 10.1016/j.brainres.2005.06.003. Brain Res. 2005. PMID: 16005445
-
Maintaining euglycemia prevents insulin-induced Fos expression in brain autonomic regulatory circuits.Pancreas. 2005 Aug;31(2):142-7. doi: 10.1097/01.mpa.0000172562.96168.59. Pancreas. 2005. PMID: 16025001
-
Role of brainstem TRH/TRH-R1 receptors in the vagal gastric cholinergic response to various stimuli including sham-feeding.Auton Neurosci. 2006 Apr 30;125(1-2):42-52. doi: 10.1016/j.autneu.2006.01.014. Epub 2006 Mar 6. Auton Neurosci. 2006. PMID: 16520096 Free PMC article. Review.
-
Gastric enteric neurones that respond to luminal injury.Neurogastroenterol Motil. 2004 Apr;16 Suppl 1:129-32. doi: 10.1111/j.1743-3150.2004.00488.x. Neurogastroenterol Motil. 2004. PMID: 15066018 Review.
Cited by
-
Glycemic Challenge Is Associated with the Rapid Cellular Activation of the Locus Ceruleus and Nucleus of Solitary Tract: Circumscribed Spatial Analysis of Phosphorylated MAP Kinase Immunoreactivity.J Clin Med. 2023 Mar 24;12(7):2483. doi: 10.3390/jcm12072483. J Clin Med. 2023. PMID: 37048567 Free PMC article.
-
Central vagal stimulation activates enteric cholinergic neurons in the stomach and VIP neurons in the duodenum in conscious rats.Peptides. 2005 Apr;26(4):653-64. doi: 10.1016/j.peptides.2004.11.015. Epub 2005 Jan 6. Peptides. 2005. PMID: 15752581 Free PMC article.
-
Food-intake dysregulation in type 2 diabetic Goto-Kakizaki rats: hypothesized role of dysfunctional brainstem thyrotropin-releasing hormone and impaired vagal output.Neuroscience. 2013 Sep 5;247:43-54. doi: 10.1016/j.neuroscience.2013.05.017. Epub 2013 May 20. Neuroscience. 2013. PMID: 23701881 Free PMC article.
-
Non-sulfated cholecystokinin-8 increases enteric and hindbrain Fos-like immunoreactivity in male Sprague Dawley rats.Brain Res. 2019 Apr 1;1708:200-206. doi: 10.1016/j.brainres.2018.12.019. Epub 2018 Dec 17. Brain Res. 2019. PMID: 30571983 Free PMC article.
-
Hypoglycemia activates arousal-related neurons and increases wake time in adult rats.Physiol Behav. 2007 Jun 8;91(2-3):240-9. doi: 10.1016/j.physbeh.2007.03.003. Epub 2007 Mar 13. Physiol Behav. 2007. PMID: 17434543 Free PMC article.
References
-
- Berthoud HR. Anatomical demonstration of vagal input to nicotinamide acetamide dinucleotide phosphate diaphorase-positive (nitrergic) neurons in rat fundic stomach. J Comp Neurol 358: 428–439, 1995. - PubMed
-
- Berthoud HR. Morphological analysis of vagal input to gastrin releasing peptide and vasoactive intestinal peptide containing neurons in the rat glandular stomach. J Comp Neurol 370: 61–70, 1996. - PubMed
-
- Berthoud HR, Carlson NR, and Powley TL. Topography of efferent vagal innervation of the rat gastrointestinal tract. Am J Physiol Regul Integr Comp Physiol 260: R200–R207, 1991. - PubMed
-
- Bjornsson ES, Urbanavicius V, Eliasson B, Attvall S, Smith U, and Abrahamsson H. Effects of hyperglycemia on interdigestive gastrointestinal motility in humans. Scand J Gastroenterol 29: 1096–1104, 1994. - PubMed
Publication types
MeSH terms
Substances
Grants and funding
LinkOut - more resources
Full Text Sources
Medical

