. 2002 Sep;184(17):4857-67.
doi: 10.1128/JB.184.17.4857-4867.2002.

Effects of the P1 plasmid centromere on expression of P1 partition genes

Affiliations

Effects of the P1 plasmid centromere on expression of P1 partition genes

Jian-Jiang Hao et al. J Bacteriol. 2002 Sep.

Abstract

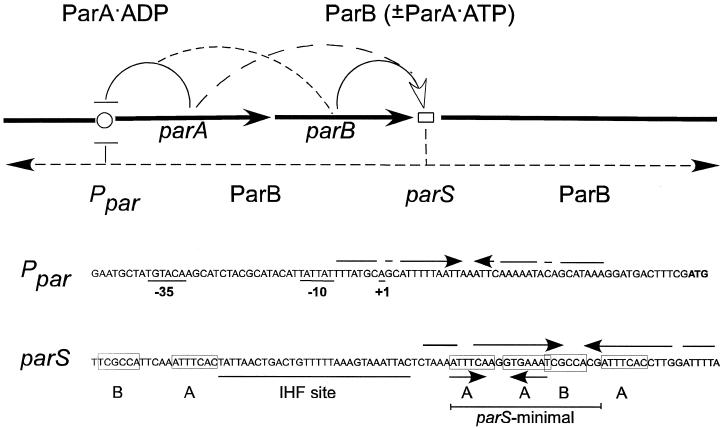
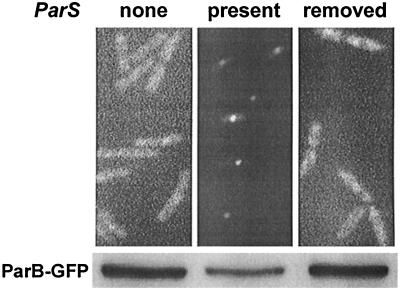
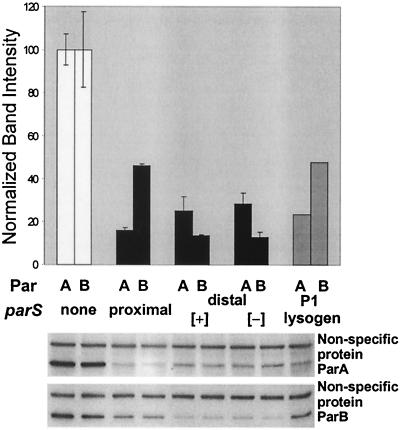
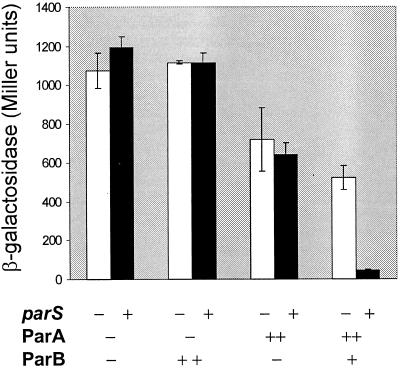
The partition operon of P1 plasmid encodes two proteins, ParA and ParB, required for the faithful segregation of plasmid copies to daughter cells. The operon is followed by a centromere analog, parS, at which ParB binds. ParA, a weak ATPase, represses the par promoter most effectively in its ADP-bound form. ParB can recruit ParA to parS, stimulate its ATPase, and significantly stimulate the repression. We report here that parS also participates in the regulation of expression of the par genes. A single chromosomal parS was shown to augment repression of several copies of the par promoter by severalfold. The repression increase was sensitive to the levels of ParA and ParB and to their ratio. The increase may be attributable to a conformational change in ParA mediated by the parS-ParB complex, possibly acting catalytically. We also observed an in cis effect of parS which enhanced expression of parB, presumably due to a selective modulation of the mRNA level. Although ParB had been earlier found to spread into and silence genes flanking parS, silencing of the par operon by ParB spreading was not significant. Based upon analogies between partitioning and septum placement, we speculate that the regulatory switch controlled by the parS-ParB complex might be essential for partitioning itself.


Figures

FIG. 1.
FIG. 1.
Regulatory and structural features of the P1 partition operon. Arcs between straight solid arrows representing genes and the symbols for Ppar and for parS indicate that the corresponding proteins can bind to the indicated sites. The dashed arc from parB indicates that ParB can assist the binding of ParA (preferentially in the ADP form) to Ppar; the dashed arc from parA indicates that ParA (in the ATP form) can bind to the ParB-parS complex. The dashed arrows to the right and left of parS in the circuit diagram indicate the capacity of ParB to spread bidirectionally from a nucleation site within parS. The boxed heptamers (A) and hexamers (B) in the parS sequence are ParB binding sites.
FIG. 2.
FIG. 2.
Influence of a chromosomally inserted parS on the distribution and total amount of GFP-tagged ParB in E. coli carrying Ppar-parA parB::gfp in pBR322(pOBK1). Upper panels, from left to right, show fluorescence-phase micrographs of BR6902, the same strain into which parS had been inserted (BR6903), and a strain (BR8245) identical to BR6902 but derived from BR6903 by excision of parS by infection with an int+ xis+ Δattλ λimm434 bacteriophage (gift from R. A. Weisberg) and cured of the excised DNA by subsequent outgrowth. The lower panels show immunoblots of the GFP-tagged ParB detected with anti-ParB serum. Equal amounts of protein were loaded on the gels.
FIG. 3.
FIG. 3.
Position effects on the contribution of parS to regulation. Immunoblots with anti-ParB serum are shown in the lower panel, and the band intensities normalized to those of a nonspecific protein are presented in the upper panel. The E. coli strains each carried the par operon inserted at attλ and a spectinomycin resistance gene at attHK022. The strains, from left to right, were BR7325 (parS deleted), BR7327 (parS included at the end of the par operon), BR7321 (parS inserted at attHK022), BR7321 (parS inverted with respect to its orientation in BR7323), and BR7685 (a P1 lysogen). Independent insertion events generated the pairs of strains tested. The graphed data are based on the average of the two separate determinations, except in the case of the P1 lysogen, where a single determination was made.
FIG. 4.
FIG. 4.
Dependence of the contribution of parS to repression on the presence of both ParA and ParB. The reporters of repression were BR8295 and BR8297, in which Ppar-lacZ was at the HK022 attachment site and parS, if present, was at the lambda attachment site. These strains were transformed with pBR322 and pMMB67EH (the mini-RSF1010 Ptac vector control), with MLO24 and pHJ25 (supplying ParA from both vectors), with pMLO102 and pOAR32 (supplying ParB from both vectors), or with pHJ25 and pRE7 (supplying ParA from pBR322 Ptrp-parA and both ParA and ParB from the pMMB67EH derivative). In this experiment, no inducer of either Ptrp or Ptac was present.
FIG. 5.
FIG. 5.
Repression of Ppar-lacZ as a function of the presence of ParA and ParB (supplied together) in the absence or presence of parS. (A) Relationship between repression and inducer concentration. Partition proteins supplied from a par operon under Ptac control (pRE7). The strains without and with parS were BR8280 and BR8282, respectively. The reporter of repression was a Ppar-lacZ inserted in pGB2 (pHJ24). Solid white line, parS absent; solid thick black line, parS present; solid thin black line, ratio; dotted line, control plasmid pMMB67EH substituted for pRE7. The data for the vector controls are indicated with white crosses for BR8280 and with black crosses for BR8282. Protein levels were approximately proportional to the concentration of inducer over the range shown, as seen in panel B. (B) Relationship between inducer and protein concentration. The graph of protein levels in cells grown with inducer at the indicated concentrations is based on the immunoblots with anti-ParB serum, using ParB His6-tagged at the C terminus as the standard and calculating the number of ParB dimers per cell (∼ equal to the number of ParA dimers per cell) by assuming that a viable cell count of a log-phase culture corresponds to 6.7 × 10⁸ cells per OD600 unit, as determined separately. No significant interference with coordinate expression of the two proteins was caused by the separate parB promoter internal to parA, at least at the inducer concentrations at which the two proteins could be estimated.
FIG. 6.
FIG. 6.
Repression of Ppar-lacZ as a function of the presence of ParA and ParB, supplied from independently inducible sources, in the absence or presence of parS. Partition proteins were supplied from BR7377 (without parS) and BR7378 (with parS) in which the par genes are located at attHK022. ParA was inducible by IPTG, and ParB was inducible by IAA. The reporter of repression was pHJ7. Vector controls were pHJ7 transformants of BR8280 and BR8282 which do not encode Par proteins. Definitions of the lines in the graphs are as described for Fig. 5. Data are the averages of two or three experiments. Protein concentrations are deduced from immunoblots as described for Fig. 5 (data not shown). Molarities were approximated by assuming a cell volume of 1 fl; i.e., a concentration of 1 μM corresponds to about 600 molecules per cell.
FIG. 7.
FIG. 7.
Limited capacity of spreading-defective ParB mutants to act as corepressors. Repression of the Ppar-lacZ present on the plasmid pHJ7 was measured in strains BR8280 and BR8282 transformed with plasmid sources of the partition proteins (i.e., in the absence or presence of a single chromosomal parS). ParA was supplied from pJH25 induced with 10 μM IPTG and ParB from pMLO102 in the absence or presence of 20 μg of IAA/ml as inducer. The ParB mutant proteins were described previously (39) and have been further characterized (16, 51). The immunoblots shown, which reveal that the mutant and wild-type ParB proteins were at comparable levels, were the results of immunoblotting performed on the transformants of BR8282. IPTG (10 μM) and IAA (20 μg/ml) were present during growth. Similar results were obtained with transformants of BR8280 (data not shown).
FIG. 8.
FIG. 8.
Position effects on the contribution of parS to regulation of genes under Ptrp control. Protein levels were determined from the immunoblots shown below and were normalized on the basis of the nonspecific protein bands. The values are plotted for each set of constructs in arbitrary units, with 100 units taken as the highest average level. (A) Experiment identical to that of Fig. 3, except that Ppar was replaced by Ptrp. The bar graph is based on averages of two values. (B) As described for panel A, except that parB was replaced by parB′::gfp::′parB and GFP was assayed in place of ParB. The bar graph is based on the averages of three values. (C) As described for panel B, except that parA was deleted. The bar graph is based on the averages of three values.

Similar articles

Cited by

References

    1. Austin, S., and K. Nordström. 1990. Partition-mediated incompatibility of bacterial plasmids. Cell 60:351-354. - PubMed
    1. Autret, S., R. Nair, and J. Errington. 2001. Genetic analysis of the chromosome segregation protein Spo0J of Bacillus subtilis: evidence for separate domains involved in DNA binding and interactions with Soj protein. Mol. Microbiol. 41:743-755. - PubMed
    1. Bolivar, F., R. L. Rodriguez, P. J. Greene, M. C. Betlach, H. L. Heyneker, and H. W. Boyer. 1977. Construction and characterization of new cloning vehicles. II. A multipurpose cloning system. Gene 2:95-113. - PubMed
    1. Bork, P., C. Sander, and A. Valencia. 1992. An ATPase domain common to prokaryotic cell cycle proteins, sugar kinases, actin, and hsp70 heat shock proteins. Proc. Natl. Acad. Sci. USA 89:7290-7294. - PMC - PubMed
    1. Bouet, J. Y., and B. E. Funnell. 1999. P1 ParA interacts with the P1 partition complex at parS and an ATP-ADP switch controls ParA activities. EMBO J. 18:1415-1424. - PMC - PubMed

Publication types

Substances

LinkOut - more resources