. 2002 Aug 15;21(16):4307-16.
doi: 10.1093/emboj/cdf418.

Endothelium-specific platelet-derived growth factor-B ablation mimics diabetic retinopathy

Affiliations

Endothelium-specific platelet-derived growth factor-B ablation mimics diabetic retinopathy

Maria Enge et al. EMBO J. .

Abstract

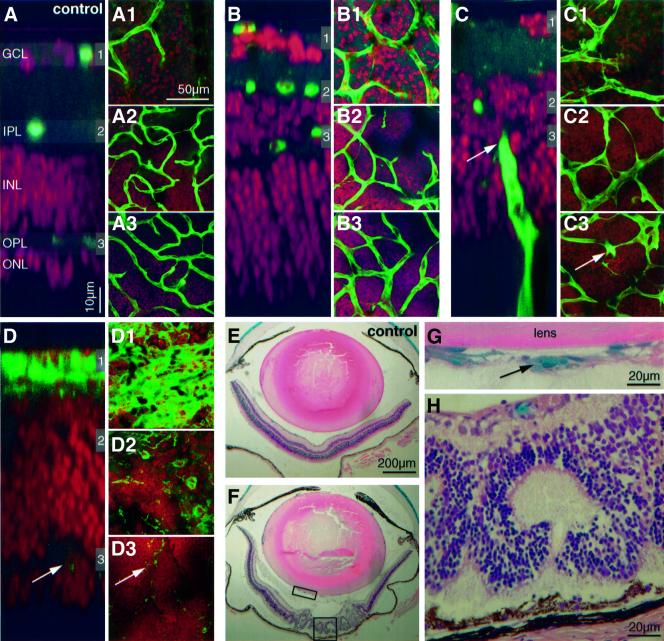
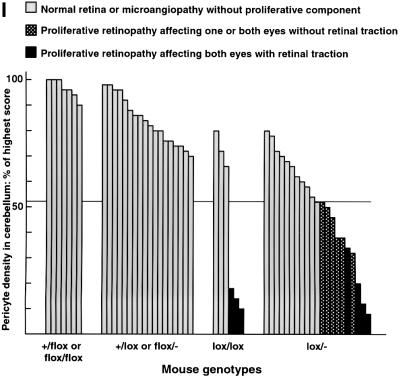
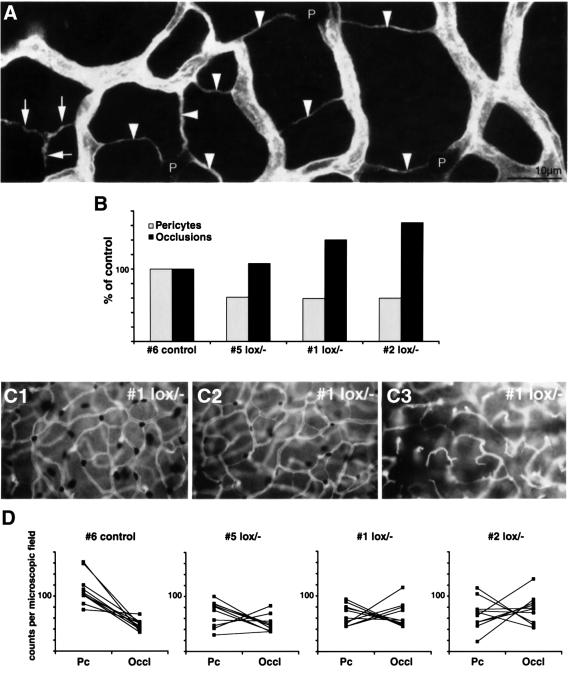
Loss of pericytes from the capillary wall is a hallmark of diabetic retinopathy, however, the pathogenic significance of this phenomenon is unclear. In previous mouse gene knockout models leading to pericyte deficiency, prenatal lethality has so far precluded analysis of postnatal consequences in the retina. We now report that endothelium-restricted ablation of platelet-derived growth factor-B generates viable mice with extensive inter- and intra-individual variation in the density of pericytes throughout the CNS. We found a strong inverse correlation between pericyte density and the formation of a range of retinal microvascular abnormalities strongly reminiscent of those seen in diabetic humans. Proliferative retinopathy invariably developed when pericyte density was <50% of normal. Our data suggest that a reduction of the pericyte density is sufficient to cause retinopathy in mice, implying that pericyte loss may also be a causal pathogenic event in human diabetic retinopathy.


Figures

None
Fig. 1. Generation of mice with endothelium-restricted PDGF-B inactivation. (A) Partial maps of the wild-type, recombinant, flox and lox alleles and the targeting construct. Boxes indicate exons. E4, exon 4; Neo, PGK-neo cassette; R, EcoRI site. Black triangles denote loxP sites. (B) Southern blot analysis of genomic EcoRI digests showing examples of initial discrimination between wild-type and recombinant alleles (left), discrimination between recombination on either side of the 3′ loxP site (middle) and conversion from recombinant to flox allele (right). Probes used are indicated in (A). (C) Outline of PCR strategies used to discriminate between PDGF-B wild-type, flox, lox and knockout (K/O) alleles. (D) Genotyping of brain microvascular fragments. Lanes 1–9 represent fragment preparations from different lox/+ individuals. Note the inter-individual variation in flox–lox conversion. The intensity of the wild-type allele PCR fragment was similar in all individuals, serving as a control for the PCR.
None
Fig. 2. Pericyte deficiency in and around the CNS in embryonic and postnatal lox/– mice. β-Gal staining of the XlacZ4 transgene product indicates pericyte nuclei (blue). (AD) E15.5 brains of the indicated genotypes. Two PDGF-Blox/– individuals with different degrees of pericyte loss are shown (C and D); fb, forebrain; mb, midbrain. Brains of 21-day-old control (E and F left) and lox/– (E and F right) mice viewed from the side (E) and from the midline (F).
None
Fig. 3. Retinopathy in PDGF-Blox/– mice. The figure compares six individuals (A–F): (A) is wild type and (BF) are different PDGF-Blox/– individuals) with regard to retinal status (1), pericyte density and distribution in the retina (2), pial vascular plexus (3) and cerebellum (4). Relative quantification of pericyte density at four distinct sites in and adjacent to the CNS (PP, pial plexus; FC, forebrain cortex; TH, thalamus; CE, cerebellum) is shown in A5–F5. The wild-type density for each site is set to 100%. Individuals (B) and (C), which have >50% of the normal pericyte density at other sites in the CNS, show a similar degree of pericytic coverage in the retina. Individuals (D), (E) and (F), which have <50% of the normal pericyte density at all sites investigated, show severe changes in the retina, with advanced vessel abnormalities and retinal traction. In these retinas, the density of XlacZ4-positive pericytes is highly variable (black asterisks in 2 and bars in 5 show sparse regions with similar densities to the rest of the CNS; red asterisks in 2 and bars in 5 indicate regions of increased pericyte density).
None
Fig. 4. Retinopathy in PDGF-Blox/– mice. Double staining of whole-mount retinas for endothelial cells (fluorescent green) and pericytes [black, e.g. white arrows in (A) and (B)]. (A) Part of wild-type retina in which an artery (A) with branches and associated capillary network can be seen. The PDGF-Blox/– region shown in (B) displays very few pericytes and a large number of tortuous and irregular vessels. The proliferative region in (C) shows mostly a chaotic highly proliferative vasculature with highly increased numbers of endothelial cells and pericytes. (D) and (E) show examples of the capillary network in PDGF-Blox/– individuals with >50% of the normal pericyte coverage. Note the presence of microaneurysms (arrows in D), abnormal ring structure (arrowhead in D) and regression profiles (arrows in E). (F–H) show PAS-stained protease-digested PDGF-Blox/– retinas. (F) shows at low magnification a region with normal vascular density (left) bordering a proliferative region (right). (G) shows a non-proliferative area with abundant regression profiles (red arrowheads) and pyknotic nuclei (red arrows). (H) shows a proliferative area at high magnification.
None
Fig. 5. Correlation between pericyte loss and retinopathy in PDGF-Blox/– mice. (AD) Comparison of a control and three PDGF-Blox/– retinas affected differently by retinopathy. Double staining of vessels/microglia (fluorescent green) and nuclei (fluorescent red) of flat mounted retinas. A z-scan through the control retina (A) visualizes the different layers; ganglion cell layer (GCL), inner plexiform layer (IPL), inner nuclear layer (INL), outer plexiform layer (OPL) and outer nuclear layer (ONL). The gray shadowed regions numbered 1–3 indicate the levels of the corresponding pictures (A1–A3), i.e. the levels of vascular plexuses. In (B–D), note the variable thickness of the different layers, and in (C) a vessel penetrating from the choroid (arrows). In (D), the proliferative retina, total regression of the two deeper vascular plexuses leaves only scattered microglial cells in these regions (arrows). (E and F) Examples of control and PDGF-Blox/– eyes, hematoxylin and eosin staining and X-gal-positive pericytes. In (G), an example of pericyte-covered vessels in the vitreous is shown (magnification of rectangular box in F). Photoreceptor layer folding and disorganized neural layers leads to typical rosette formations in the severely affected retinas shown in (F) and (H) (magnification of squared box in F). (I) Fifty-two 3- to 4-week-old mice of different genotypes were scored for cerebellum pericyte density (highest set as 100%) and the presence of proliferative retinopathy. The 13 PDGF-Blox/– and PDGF-Blox/lox individuals with a pericyte density <52% all showed proliferative retinopathy affecting at least one eye.
None
Fig. 6. Vascular regression in PDGF-Blox/– mice. Regression profiles (arrowheads in A) were counted in the outer retinal capillary plexus in wild type and PDGF-Blox/– with different degree of pericyte loss. (B) Inter-individual inverse correlation between pericyte density in the cerebellum and the density of retinal capillary regression profiles. A similar intra-individual inverse correlation is illustrated in (C1C3), which show different regions of the same PDGF-Blox/– retina, ranging from near-normal pericyte density and few regression profiles (C1), and intermediate region (C2), to near-complete pericyte deficiency correlating with a high number of regression profiles (C3). A quantitative analysis further demonstrating the inverse correlation between pericyte count (Pc) and the number of occlusions (occl) is shown in (D). Note that the inverse correlation is seen also in controls (D, left graph), suggesting that pericyte coverage may also in part determine physiological regression. Corresponding counts from the same microscopic field are joined by a line. In PDGF-Blox/– mutant 5, an area with an almost completely regressed outer plexus showed a low number of both pericytes and occlusions.

References

    1. Abramsson A., Berlin,Ö., Papayan,H., Paulin,D., Shani,M. and Betsholtz,C. (2002) Analysis of mural cell recruitment to tumor vessels. Circulation, 105, 112–117. - PubMed
    1. Benjamin L.E., Hemo,I. and Keshet,E. (1998) A plasticity window for blood vessel remodelling is defined by pericyte coverage of the preformed endothelial network and is regulated by PDGF-B and VEGF. Development, 125, 1591–1598. - PubMed
    1. Benjamin L.E., Golijanin,D., Itin,A., Pode,D. and Keshet,E. (1999) Selective ablation of immature blood vessels in established human tumors follows vascular endothelial growth factor withdrawal. J. Clin. Invest., 103, 159–165. - PMC - PubMed
    1. Buscher C., Weis,A., Wohrle,M., Bretzel,R.G., Cohen,A.M. and Federlin,K. (1989) Islet transplantation in experimental diabetes of the rat. XII. Effect on diabetic retinopathy. Morphological findings and morphometrical evaluation. Horm. Metab. Res., 21, 227–231. - PubMed
    1. Buzney S.M., Frank,R.N., Varma,S.D., Tanishima,T. and Gabbay,K.H. (1977) Aldose reductase in retinal mural cells. Invest. Ophthalmol. Vis. Sci., 16, 392–396. - PubMed

Publication types

MeSH terms

Substances