

PTP1B antisense oligonucleotide lowers PTP1B protein, normalizes blood glucose, and improves insulin sensitivity in diabetic mice
- PMID: 12169659
- PMCID: PMC123261
- DOI: 10.1073/pnas.142298199
PTP1B antisense oligonucleotide lowers PTP1B protein, normalizes blood glucose, and improves insulin sensitivity in diabetic mice
Abstract
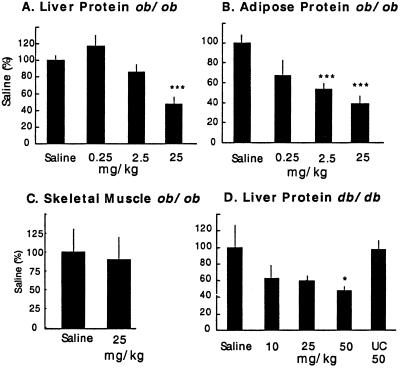
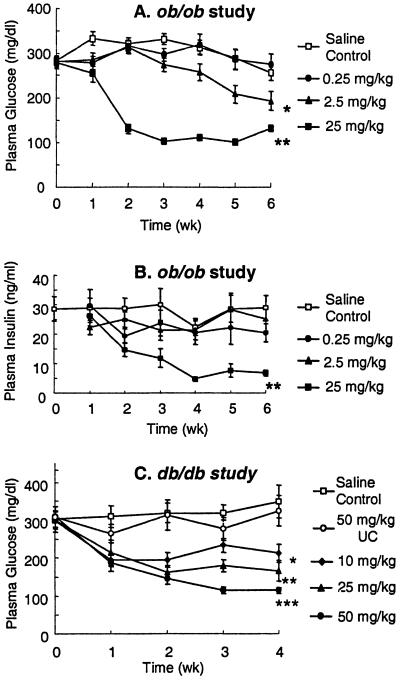
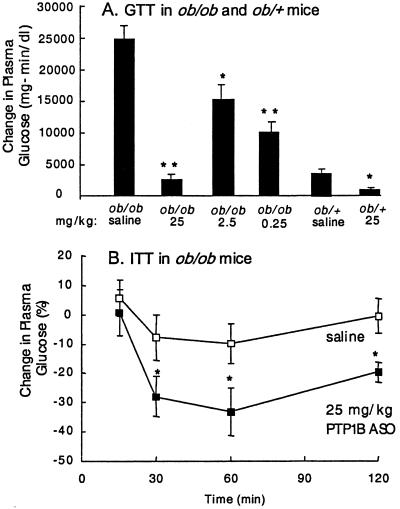
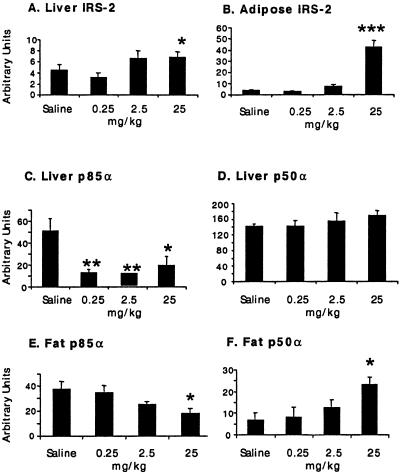
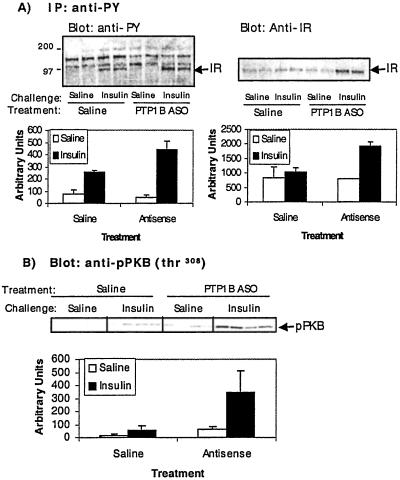
The role of protein-tyrosine phosphatase 1B (PTP1B) in diabetes was investigated using an antisense oligonucleotide in ob/ob and db/db mice. PTP1B antisense oligonucleotide treatment normalized plasma glucose levels, postprandial glucose excursion, and HbA(1C). Hyperinsulinemia was also reduced with improved insulin sensitivity. PTP1B protein and mRNA were reduced in liver and fat with no effect in skeletal muscle. Insulin signaling proteins, insulin receptor substrate 2 and phosphatidylinositol 3 (PI3)-kinase regulatory subunit p50alpha, were increased and PI3-kinase p85alpha expression was decreased in liver and fat. These changes in protein expression correlated with increased insulin-stimulated protein kinase B phosphorylation. The expression of liver gluconeogenic enzymes, phosphoenolpyruvate carboxykinase, and fructose-1,6-bisphosphatase was also down-regulated. These findings suggest that PTP1B modulates insulin signaling in liver and fat, and that therapeutic modalities targeting PTP1B inhibition may have clinical benefit in type 2 diabetes.
Figures
Similar articles
-
Reduction of PTP1B induces differential expression of PI3-kinase (p85alpha) isoforms.Biochem Biophys Res Commun. 2004 Oct 15;323(2):652-9. doi: 10.1016/j.bbrc.2004.08.138. Biochem Biophys Res Commun. 2004. PMID: 15369800
-
Protein tyrosine phosphatase 1B reduction regulates adiposity and expression of genes involved in lipogenesis.Diabetes. 2002 Aug;51(8):2405-11. doi: 10.2337/diabetes.51.8.2405. Diabetes. 2002. PMID: 12145151
-
Reduction of protein tyrosine phosphatase 1B increases insulin-dependent signaling in ob/ob mice.Diabetes. 2003 Jan;52(1):21-8. doi: 10.2337/diabetes.52.1.21. Diabetes. 2003. PMID: 12502489
-
Protein tyrosine phosphatase 1B as a target for the treatment of impaired glucose tolerance and type II diabetes.Curr Opin Investig Drugs. 2002 Nov;3(11):1608-16. Curr Opin Investig Drugs. 2002. PMID: 12476961 Review.
-
Insulin resistance induced by tumor necrosis factor-alpha in myocytes and brown adipocytes.J Anim Sci. 2008 Apr;86(14 Suppl):E94-104. doi: 10.2527/jas.2007-0462. Epub 2007 Oct 16. J Anim Sci. 2008. PMID: 17940160 Review.
Cited by
-
Molecular network analysis of phosphotyrosine and lipid metabolism in hepatic PTP1b deletion mice.Integr Biol (Camb). 2013 Jul 24;5(7):940-63. doi: 10.1039/c3ib40013a. Epub 2013 May 20. Integr Biol (Camb). 2013. PMID: 23685806 Free PMC article.
-
Improved glucose homeostasis in mice with muscle-specific deletion of protein-tyrosine phosphatase 1B.Mol Cell Biol. 2007 Nov;27(21):7727-34. doi: 10.1128/MCB.00959-07. Epub 2007 Aug 27. Mol Cell Biol. 2007. PMID: 17724080 Free PMC article.
-
Coordinated regulation of insulin signaling by the protein tyrosine phosphatases PTP1B and TCPTP.Mol Cell Biol. 2005 Jan;25(2):819-29. doi: 10.1128/MCB.25.2.819-829.2005. Mol Cell Biol. 2005. PMID: 15632081 Free PMC article.
-
Chronic insulin treatment suppresses PTP1B function, induces increased PDGF signaling, and amplifies neointima formation in the balloon-injured rat artery.Am J Physiol Heart Circ Physiol. 2009 Jan;296(1):H132-9. doi: 10.1152/ajpheart.00370.2008. Epub 2008 Nov 14. Am J Physiol Heart Circ Physiol. 2009. PMID: 19011046 Free PMC article.
-
Pharmacological effects of JTT-551, a novel protein tyrosine phosphatase 1B inhibitor, in diet-induced obesity mice.J Diabetes Res. 2014;2014:680348. doi: 10.1155/2014/680348. Epub 2014 May 29. J Diabetes Res. 2014. PMID: 24987707 Free PMC article.
References
-
- Reaven G. M. (1988) Diabetes 37, 1595-1607. - PubMed
-
- Olefsky J. M., Garvey, W. T., Henry, R. R., Brillon, D., Matthai, S. & Friedenberg, G. R. (1988) Am. J. Med. 85,Suppl. 5A, 86-105. - PubMed
-
- Kruszynska Y. T. & Olefsky, J. M. (1996) J. Invest. Med. 44, 413-428. - PubMed
-
- Youngren J. F. & Goldfine, I. D. (1997) Sci. Med. 4, 18-27.
-
- Kahn C. R. (1994) Diabetes 43, 1066-1084. - PubMed
MeSH terms
Substances
LinkOut - more resources
Full Text Sources
Other Literature Sources
Medical
Miscellaneous
