

Microarray analysis of B-cell lymphoma cell lines with the t(14;18)
- PMID: 12169673
- PMCID: PMC1906980
- DOI: 10.1016/S1525-1578(10)60693-9
Microarray analysis of B-cell lymphoma cell lines with the t(14;18)
Abstract
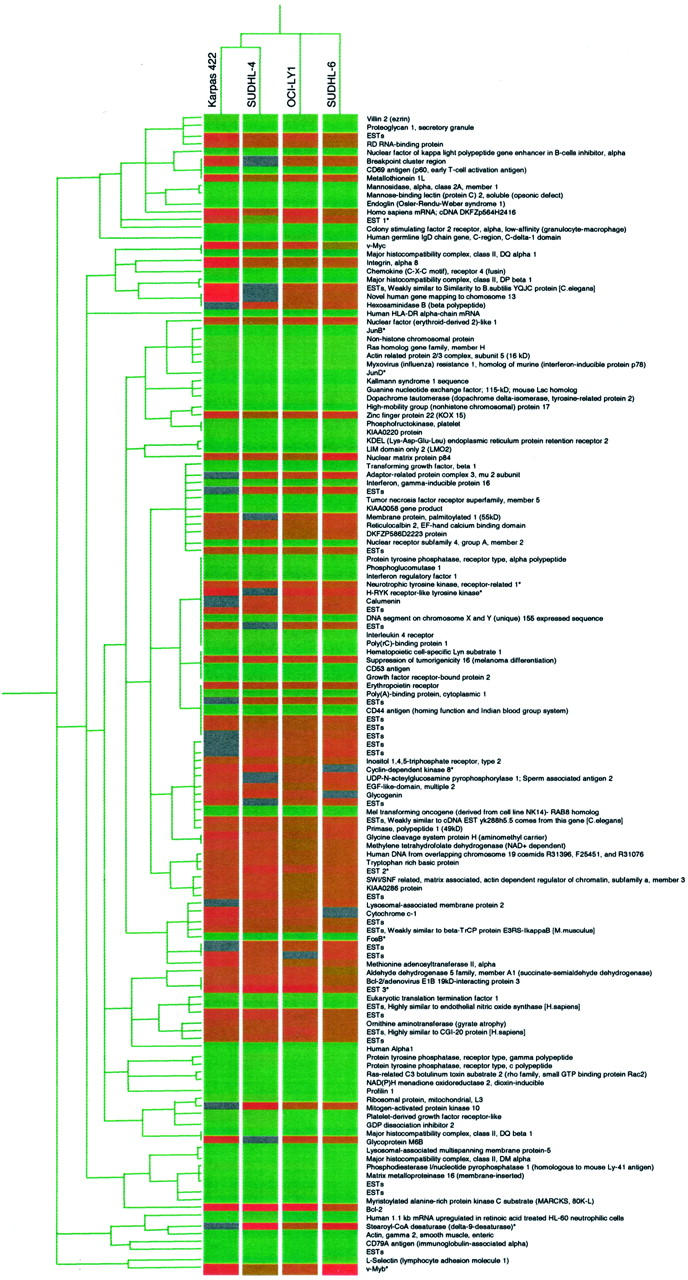
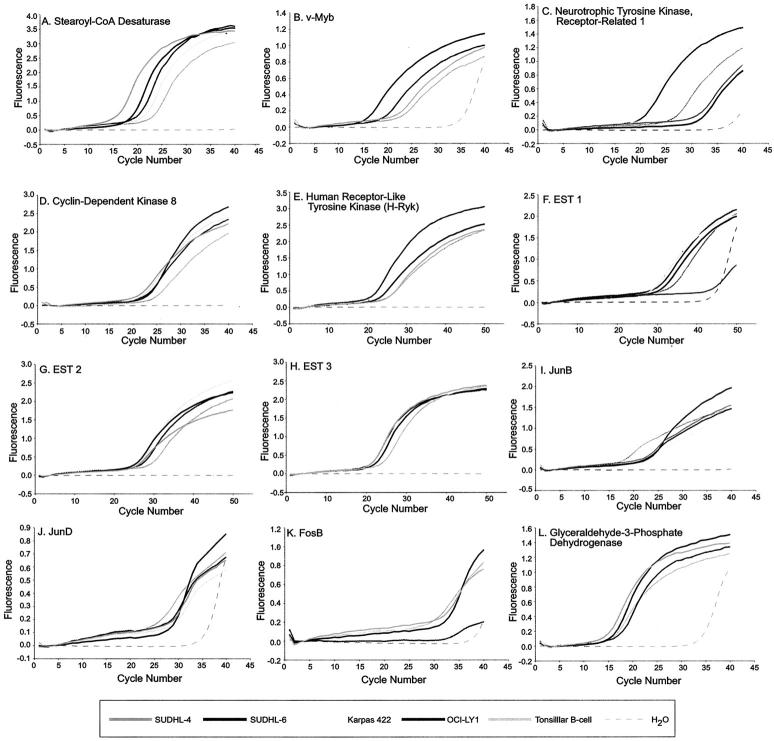
The t(14;18) is the most common genetic alteration in follicular lymphoma, and is detectable in a subset of diffuse large B-cell lymphomas (DLBCL), resulting in over-expression of the anti-apoptotic protein BCL-2. Although the t(14;18)-induced over-expression of BCL-2 is an important step in lymphomagenesis, this aberration alone is not sufficient to produce malignant lymphoma. Further analysis of these tumors is needed to identify additional genes that might be involved in the genesis of follicular lymphoma and progression to DLBCL. To address this issue, we analyzed the gene expression profiles of four t(14;18)-positive cell lines and two t(11;14)-positive mantle-cell lymphoma cell lines using cDNA microarrays containing 4364 genes, and compared them to the genetic profile of phenotypically purified B-cells obtained from hyperplastic tonsils. A total of 137 genes were differentially expressed by approximately twofold or more in the t(14;18) cell lines relative to tonsillar B-cells. 68 genes were up-regulated, 69 genes were down-regulated, and approximately 20% of the differentially regulated genes had no known function. The up-regulated genes included a number of genes involved in the promotion of cellular proliferation and survival, as well as cell metabolism. Down-regulated genes included mediators of cell adhesion and negative regulators of cell activation and growth. Hierarchical clustering analysis separated the t(14;18) and mantle-cell lines into distinct groups based on their gene expression profiles. We confirmed the differential expression of approximately 80% of selected up- and down-regulated genes identified by microarray analysis by quantitative real-time fluorescence reverse transcriptase polymerase chain reaction (RT-PCR) analysis and/or immunoblotting. This study demonstrates the utility of cDNA microarray analysis for the assessment of global transcriptional changes that characterize t(14;18)-positive cell lines, and also for the identification of novel genes that could potentially contribute to the genesis and progression of non-Hodgkin's lymphomas with this translocation.
Figures


Similar articles
-
CD10 antigen expression correlates with the t(14;18)(q32;q21) major breakpoint region in diffuse large B-cell lymphoma.Mod Pathol. 1999 Mar;12(3):295-300. Mod Pathol. 1999. PMID: 10102615
-
BCL2 mutation spectrum in B-cell non-Hodgkin lymphomas and patterns associated with evolution of follicular lymphoma.Hematol Oncol. 2015 Mar;33(1):23-30. doi: 10.1002/hon.2132. Epub 2014 Feb 4. Hematol Oncol. 2015. PMID: 24496723
-
Polymerase chain reaction for bcl-2 in diagnostic lymph node biopsies.Mod Pathol. 1990 Nov;3(6):659-63. Mod Pathol. 1990. PMID: 2263590
-
[Molecular abnormalities in lymphomas].Bull Cancer. 2010 Nov;97(11):1347-64. doi: 10.1684/bdc.2010.1214. Bull Cancer. 2010. PMID: 21084243 Review. French.
-
Pathology, pathogenesis and molecular genetics of follicular NHL.Best Pract Res Clin Haematol. 2011 Jun;24(2):95-109. doi: 10.1016/j.beha.2011.02.003. Epub 2011 Apr 7. Best Pract Res Clin Haematol. 2011. PMID: 21658611 Review.
Cited by
-
IFI16 Expression Is Related to Selected Transcription Factors during B-Cell Differentiation.J Immunol Res. 2015;2015:747645. doi: 10.1155/2015/747645. Epub 2015 Jun 22. J Immunol Res. 2015. PMID: 26185770 Free PMC article.
-
Alteration of the lipid profile in lymphomas induced by MYC overexpression.Proc Natl Acad Sci U S A. 2014 Jul 22;111(29):10450-5. doi: 10.1073/pnas.1409778111. Epub 2014 Jul 3. Proc Natl Acad Sci U S A. 2014. PMID: 24994904 Free PMC article.
-
Utility of linearly amplified RNA for RT-PCR detection of chromosomal translocations: validation using the t(2;5)(p23;q35) NPM-ALK chromosomal translocation.J Mol Diagn. 2004 Feb;6(1):16-21. doi: 10.1016/S1525-1578(10)60486-2. J Mol Diagn. 2004. PMID: 14736822 Free PMC article.
-
Validation of cDNA microarray gene expression data obtained from linearly amplified RNA.Mol Pathol. 2003 Dec;56(6):307-12. doi: 10.1136/mp.56.6.307. Mol Pathol. 2003. PMID: 14645691 Free PMC article.
-
Evaluation of the Synergistic Potential of Simultaneous Pan- or Isoform-Specific BET and SYK Inhibition in B-Cell Lymphoma: An In Vitro Approach.Cancers (Basel). 2022 Sep 27;14(19):4691. doi: 10.3390/cancers14194691. Cancers (Basel). 2022. PMID: 36230614 Free PMC article.
References
-
- Yunis JJ, Oken MM, Kaplan ME, Ensrud KM, Howe RR, Theologides A: Distinctive chromosomal abnormalities in histologic subtypes of non-Hodgkin’s lymphoma. N Engl J Med 1982, 307:1231-1236 - PubMed
-
- Jacobson JO, Wilkes BM, Kwaiatkowski DJ, Medeiros LJ, Aisenberg AC, Harris NL: Bcl-2 rearrangements in de novo diffuse large-cell lymphoma: association with distinctive clinical features. Cancer 1993, 72:231-236 - PubMed
-
- Weiss LM, Warnke RA, Sklar J, Cleary ML: Molecular analysis of the t(14;18) chromosomal translocation in malignant lymphomas. N Engl J Med 1987, 317:1185-1189 - PubMed
-
- Bakhshi A, Jensen JP, Goldman P, Wright JJ, McBride OW, Epstein AL, Korsmeyer SJ: Cloning the chromosomal breakpoint of t(14;18) human lymphomas: clustering around JH on chromosome 14 and near a transcriptional unit on 18. Cell 1985, 41:899-906 - PubMed
Publication types
MeSH terms
Substances
Grants and funding
LinkOut - more resources
Full Text Sources
Other Literature Sources
Research Materials
