. 2002 Jul;201(1):31-9.
doi: 10.1046/j.1469-7580.2002.00074.x.

Central nervous system phenotypes in craniosynostosis

Affiliations

Central nervous system phenotypes in craniosynostosis

Kristina Aldridge et al. J Anat. 2002 Jul.

Abstract

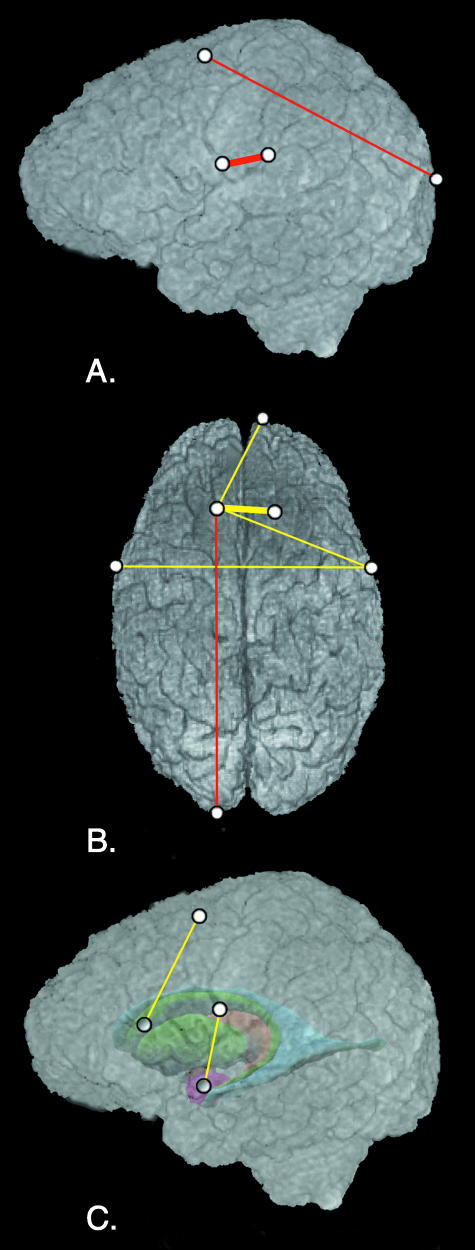
Though reduction in the number of cranial elements through loss of a suture is a recognized trend in vertebrate evolution, the premature closure of cranial sutures in humans, craniosynostosis, is considered a pathological condition. Previous research on craniosynostosis has focused primarily on the skeletal phenotype, but the intimate relationship between the developing central nervous system (CNS) and skull is well documented. We investigate the morphology of the CNS in patients with isolated craniosynostosis through an analysis of cortical and subcortical features using 3-D magnetic resonance images (MRI). Results show that a distinct CNS phenotype can be defined for specific diagnostic categories. Many differences in CNS morphology observed in the patient samples may be anticipated based on skeletal morphology, but others are not reflected in the skull. We propose a developmental approach to determining the cause of premature suture fusion, which includes investigation of the craniofacial complex as a system, rather than study of isolated tissues.


Figures

Fig. 1
Fig. 1
Three-dimensional reconstructions of computed tomography (CT) scans and magnetic resonance images (MRI) of children affected with three forms of isolated craniosynostosis—sagittal, metopic and unicoronal, and one unaffected by craniosynostosis. These cases were chosen from our archive as examples of craniosynostosis phenotypes.
Fig. 2
Fig. 2
Three forms of similar volumes, but of different shape, illustrate the inability of size measurements to provide information about differences in shape.
Fig. 3
Fig. 3
Landmarks collected from the MRIs are illustrated on (A) 3-D MRI reconstruction of the cortical surface, (B) a model of subcortical structures and (C) a sagittal slice of an MRI of a child with ISS. Landmarks are as follows: 1,2 Frontal pole; 3,4 Posterior termination of the superior frontal sulcus; 5,6 Posterior termination of the inferior frontal sulcus; 7,8 Inferolateral termination of the central sulcus; 9,10 Posterior termination of the Sylvian fissure; 11,12 Occipital pole; 13,14 Anterior horn of the lateral ventricle; 15,16 Centroid of the head of the caudate nucleus; 17,18 Centroid of the thalamus; 19,20 Centroid of the amygdala; 21,22 Inferior horn of the lateral ventricle; 23,24 Posterior horn of the lateral ventricle; 25 Midline of the most superior aspect of the pons; 26 Midline of the most inferior aspect of the pons; 27 Midline of the genu of the corpus callosum; 28 Midline of the anterior commissure; 29,30 Centroid of the superior colliculus; 31,32 Centroid of the inferior colliculus; 33 Junction of the cerebral aqueduct and the 4th ventricle; 34 Posterior-most aspect of the 4th ventricle.
Fig. 4
Fig. 4
Results of tests of the null hypothesis of similarity in form between ISS and NA samples. Yellow lines indicate significant differences which are greater in the ISS sample. Red lines indicate significant differences which are smaller in the ISS sample. Heavy lines indicate significant differences of 15% or greater; thin lines indicate significant differences of 5–14%. These results are illustrated on an individual chosen as an example from the study sample and is not meant to represent an average ISS phenotype.
Fig. 5
Fig. 5
Results of tests of the null hypothesis of similarity in form between IMS and NA samples. Yellow lines indicate significant differences which are greater in the IMS sample. Red lines indicate significant differences which are smaller in the IMS sample. Heavy lines indicate significant differences of 15% or greater; thin lines indicate significant differences of 5–14%. These results are illustrated on an individual chosen as an example from the study sample and is not meant to represent an average IMS phenotype.

References

    1. Aboitiz F. Does bigger mean better? Evolutionary determinants of brain size and structure. Brain Behav. Evol. 1996;47:225–245. - PubMed
    1. Aldridge K, Barta PE, Pearlson GD, Richtsmeier JT. Brain morphology, MRI data, and landmark-based analyses of form. Am. J. Phys. Anthropol. Suppl. 2000;30:94. (abstract)
    1. Aldridge K, Marsh JL, Perlyn C, Richtsmeier JT. Quantification of central nervous system dysmorphology in isolated craniosynostoses. Fifty-Eighth Annual Meeting of the American Cleft Palate–Craniofacial Association, Minneapolis, MN. 2001. (abstract)
    1. Aylward EH, Augustine AM, Li Q, Barta PE, Pearlson GD. Measurement of frontal lobe Volume on magnetic resonance imaging scans. Psychiatry Res. 1997;75:23–30. - PubMed
    1. Barta PE, Dhingra L, Royall R, Schwartz E. Improving stereological estimates for the Volume of structures identified in three-dimensional arrays of spatial data. J. Neurosci. Meth. 1997;75:111–118. - PubMed

Publication types