

Signature of balancing selection in Arabidopsis
- PMID: 12172007
- PMCID: PMC123289
- DOI: 10.1073/pnas.172203599
Signature of balancing selection in Arabidopsis
Abstract
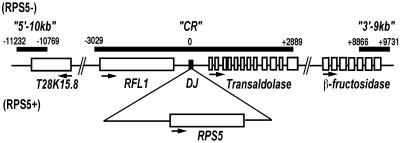
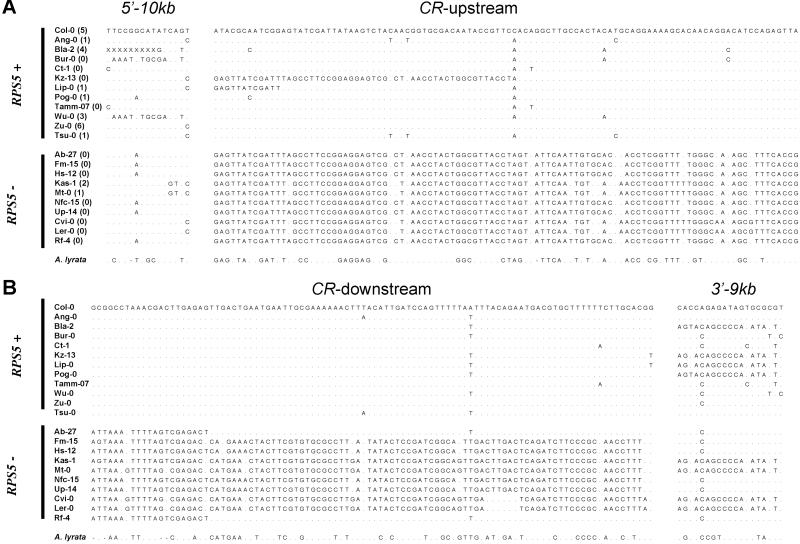
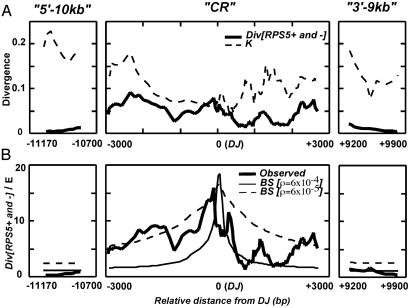
Natural selection and genetic linkage cause DNA segments to have genealogical histories resembling those of the selected sites. When a polymorphism maintained by selection is old, it will have an island of enhanced sequence variability surrounding it, which represents a detectable "signature of selection." We investigate the structure of single-nucleotide polymorphisms (SNPs) in a 20-kb interval containing the Arabidopsis thaliana disease resistance gene RPS5, a locus containing common alleles for the presence/absence of the entire locus. The alleles are considerably diverged at surrounding sites, indicative of an old polymorphism maintained by selection. The island of "enhanced" variability extends several kilobases to either side of the RPS5 deletion junction, and these SNPs are in nearly complete linkage disequilibrium with the RPS5 insertion/deletion. At a distance of 10 kb to either side of the locus, however, we find low levels of polymorphism and the absence of linkage disequilibrium between individual SNPs and RPS5 alleles. Our results show that the interval of enhanced variability surrounding this balanced polymorphism in Arabidopsis is large enough to be readily detected, but small enough to span the focal gene and few others. For this species it should be possible to identify the complete set of genes with long-lived polymorphisms, a potentially important subset of genes segregating for functional variants.
Figures
References
Publication types
MeSH terms
Substances
Associated data
- Actions
- Actions
- Actions
- Actions
- Actions
- Actions
- Actions
- Actions
- Actions
- Actions
- Actions
- Actions
- Actions
- Actions
- Actions
- Actions
- Actions
- Actions
- Actions
- Actions
- Actions
- Actions
- Actions
- Actions
- Actions
- Actions
- Actions
- Actions
- Actions
- Actions
- Actions
- Actions
- Actions
- Actions
- Actions
- Actions
- Actions
- Actions
- Actions
- Actions
- Actions
- Actions
- Actions
- Actions
- Actions
- Actions
- Actions
- Actions
- Actions
- Actions
- Actions
- Actions
- Actions
- Actions
- Actions
- Actions
- Actions
- Actions
- Actions
- Actions
- Actions
- Actions
- Actions
- Actions
- Actions
Grants and funding
LinkOut - more resources
Full Text Sources
Other Literature Sources
Molecular Biology Databases
