. 2002 Aug;14(8):1675-90.
doi: 10.1105/tpc.003483.

Arabidopsis transcriptome profiling indicates that multiple regulatory pathways are activated during cold acclimation in addition to the CBF cold response pathway

Affiliations

Arabidopsis transcriptome profiling indicates that multiple regulatory pathways are activated during cold acclimation in addition to the CBF cold response pathway

Sarah Fowler et al. Plant Cell. 2002 Aug.

Abstract

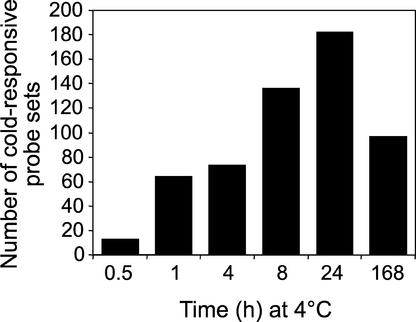
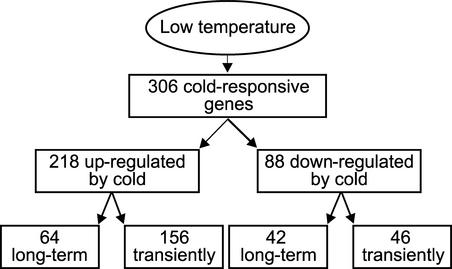
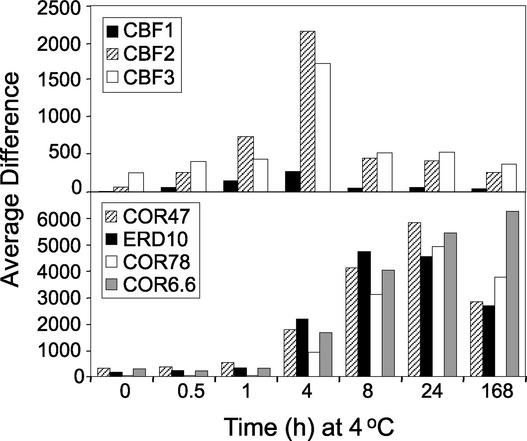
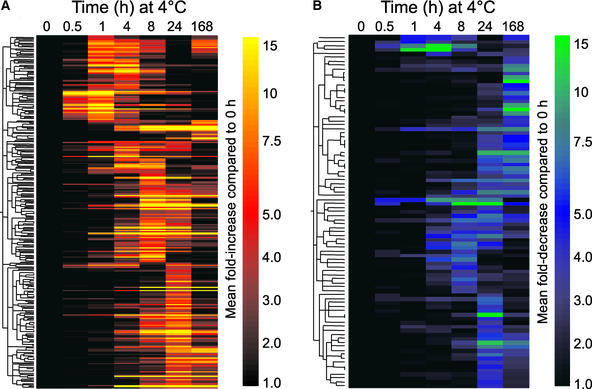
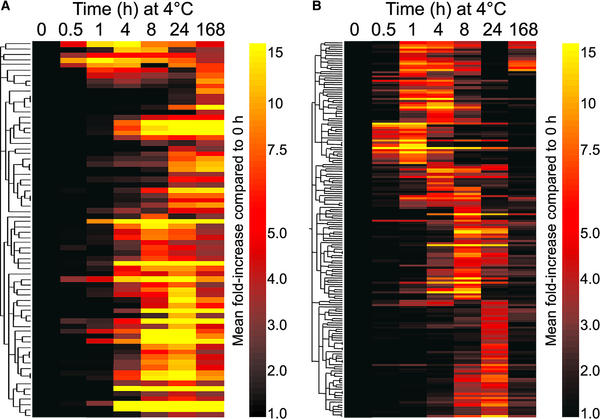
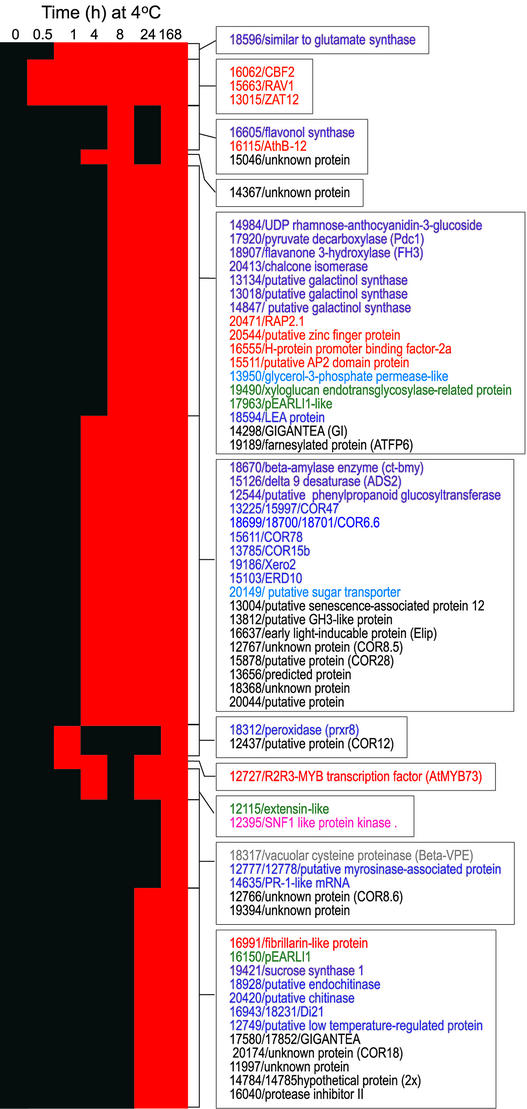
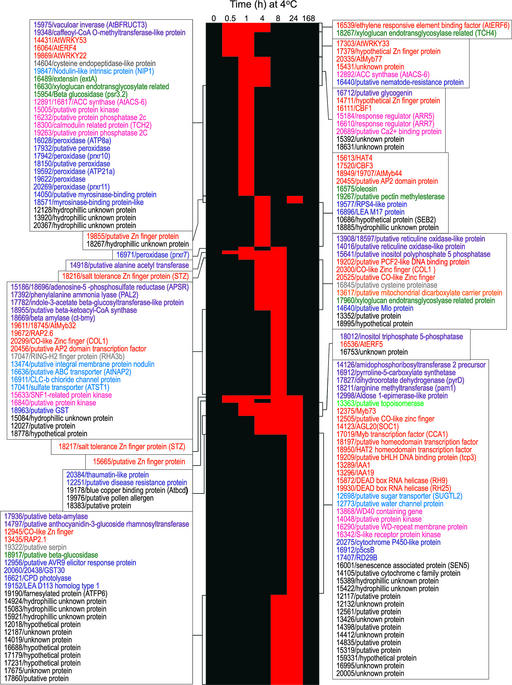
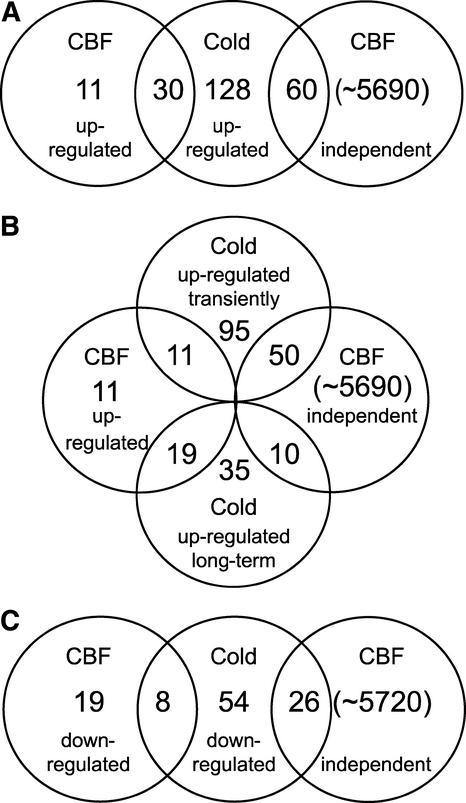
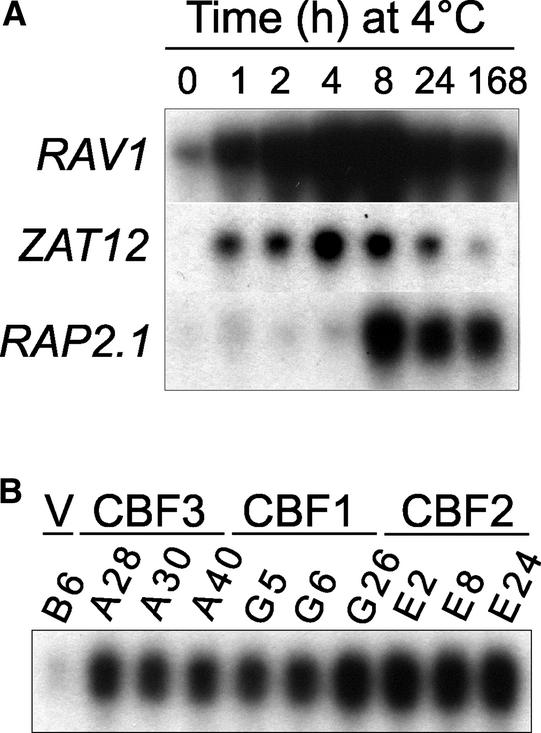
Many plants, including Arabidopsis, increase in freezing tolerance in response to low, nonfreezing temperatures, a phenomenon known as cold acclimation. Previous studies established that cold acclimation involves rapid expression of the CBF transcriptional activators (also known as DREB1 proteins) in response to low temperature followed by induction of the CBF regulon (CBF-targeted genes), which contributes to an increase in freezing tolerance. Here, we present the results of transcriptome-profiling experiments indicating the existence of multiple low-temperature regulatory pathways in addition to the CBF cold response pathway. The transcript levels of approximately 8000 genes were determined at multiple times after plants were transferred from warm to cold temperature and in warm-grown plants that constitutively expressed CBF1, CBF2, or CBF3. A total of 306 genes were identified as being cold responsive, with transcripts for 218 genes increasing and those for 88 genes decreasing threefold or more at one or more time points during the 7-day experiment. These results indicate that extensive downregulation of gene expression occurs during cold acclimation. Of the cold-responsive genes, 48 encode known or putative transcription factors. Two of these, RAP2.1 and RAP2.6, were activated by CBF expression and thus presumably control subregulons of the CBF regulon. Transcriptome comparisons indicated that only 12% of the cold-responsive genes are certain members of the CBF regulon. Moreover, at least 28% of the cold-responsive genes were not regulated by the CBF transcription factors, including 15 encoding known or putative transcription factors, indicating that these cold-responsive genes are members of different low-temperature regulons. Significantly, CBF expression at warm temperatures repressed the expression of eight genes that also were downregulated by low temperature, indicating that in addition to gene induction, gene repression is likely to play an integral role in cold acclimation.


Figures

Figure 1.
Figure 1.
Number of GeneChip Probe Sets Representing Genes That Were Either Upregulated or Downregulated at Various Times after Transfer of Plants from Warm (22°C) to Cold (4°C) Temperature.
Figure 2.
Figure 2.
Summary of Classes of Cold-Responsive Genes. Details of selection criteria are described in the text. The total number of upregulated genes listed (218) is less than 156 (transient) + 64 (long-term) because probe sets representing two genes were present in both the transient and long term lists.
Figure 3.
Figure 3.
GeneChip Results for Genes Reported Previously as Upregulated during Cold Acclimation. Probe sets used to calculate mean average difference values were as follows: COR47, probe sets 13225_s_at and 15997_s_at; ERD10, probe set 15103_s_at; COR78, probe set 15611_s_at; and COR6.6, probe sets 18699_i_at, 18700_r_at, and 18701_s_at. Where multiple probe sets were present that corresponded to a single gene, the mean average difference obtained for all corresponding probe sets was plotted.
Figure 4.
Figure 4.
Hierarchical Clustering of Cold-Responsive Genes. The fold change values for genes that were upregulated (A) (n = 241 probe sets representing 218 genes) or downregulated (B) (n = 89 probe sets representing 88 genes) during cold acclimation (see Methods) were preprocessed so that fold change values that were associated with a difference call of no change were converted to 1. The mean of the four fold change values for each time point then was calculated, and the data were clustered using a Pearson correlation. Scales indicating the color assigned to each fold change are shown to the right of each cluster.
Figure 5.
Figure 5.
Hierarchical Clustering of Genes Upregulated by Cold. Fold change values that were associated with a difference call of no change were converted to 1. The mean fold change values for each time point then were calculated, and the data were clustered. A scale indicating the color assigned to each fold change is shown to the right of the cluster. (A) Clustering of the 64 genes (represented by 72 probe sets) that were upregulated by at least 2.5-fold after 7 days of cold treatment. (B) Clustering of the 156 genes (represented by 169 probe sets) that were upregulated 3-fold at any time between 30 min and 24 h but were upregulated by less than 2.5-fold after 7 days of cold treatment.
Figure 6.
Figure 6.
“Binary” Hierarchical Clustering of Long-Term Upregulated Genes. Data points at which the signal intensity indicated that the gene was present for both duplicate cold samples, that there was a difference call of increase for all four comparisons, and that the fold increase value was ≥2.5 for all four comparisons were assigned a value of 2 (red), whereas all other data points were assigned a value of 1 (black). The resulting data then were clustered. The probe set number and the description of the genes that fall into each cluster are indicated at right. The text color indicates the known or predicted role of each gene: metabolism, purple; cell growth, cell division, and DNA synthesis, light green; transcription, red; protein fate, gray; transport facilitation, light blue; intracellular transport, orange; cellular biogenesis, dark green; cellular communication and signal transduction, pink; cell rescue, defense, cell death, and aging, dark blue; unclassified proteins, black.
Figure 8.
Figure 8.
Hydropathy Plots for Novel COR-Like Proteins. The amino acid sequence predicted from the sequence of COR-like proteins was analyzed using the method of Kyte and Doolittle (1982) to predict the regional hydropathy of the encoded polypeptides. Values > 0 correspond to hydrophilic regions, and values < 0 correspond to hydrophobic regions. The scale at top of each plot shows the number of amino acids from the N terminus of the polypeptide. The polypeptide encoded by At4g33550 is predicted to have a signal peptide (iPSORT; www.HypothesisCreator.net/iPSORT/) that is cleaved where indicated by the arrow. The hydropathy profile of COR6.6 is shown for comparison.
Figure 9.
Figure 9.
“Binary” Hierarchical Clustering of Transiently Upregulated Genes. Data points at which the signal intensity indicated that the gene was present for both duplicate cold samples, that there was a difference call of increase for all four comparisons, and that the fold increase value was ≥3 for all four comparisons were assigned a value of 2 (red), whereas all other data points were assigned a value of 1 (black). The resulting data then were clustered. The probe set number and the description of the genes that fall into each cluster are indicated at right. The text color indicates the known or predicted role of each gene: metabolism, purple; cell growth, cell division, and DNA synthesis, light green; transcription, red; protein fate, gray; transport facilitation, light blue; intracellular transport, orange; cellular biogenesis, dark green; cellular communication and signal transduction, pink; cell rescue, defense, cell death, and aging, dark blue; unclassified proteins, black.
Figure 10.
Figure 10.
Venn Diagrams of Comparisons between Cold-Responsive Genes and Genes That Are Part of the CBF Regulon. Sets of genes were selected using the criteria described in Methods. The number of genes in each set is displayed within a circle above a description of the set. Genes present in two sets are shown in the intersection of the two sets, so that the sum of the numbers within a circle is the total number of genes in that set. (A) Intersection of genes that are upregulated in response to low temperature with those that are either upregulated by or independent of CBF overexpression. (B) Intersection of genes that are either transiently or long-term upregulated in response to low temperature with those that are either upregulated by or independent of CBF overexpression. (C) Intersection of genes that are downregulated in response to low temperature with those that are either downregulated by or independent of CBF overexpression.
Figure 7.
Figure 7.
Transcript Levels for Cold-Regulated Transcription Factors RAV1, ZAT12, and RAP2.1. (A) Two-week-old wild-type (Wassilewskija-2) plants grown at 22°C were cold treated at 4°C, and tissue was harvested at the times indicated. Total RNA was isolated, and RNA gel blots were prepared (10 μg of RNA). The blots were hybridized with 32P-labeled probes for RAV1, ZAT12, and RAP2.1. (B) Total RNA was isolated from 2-week-old plants from transgenic lines expressing the indicated CBF genes under the control of the 35S promoter of Cauliflower mosaic virus or carrying the empty vector (V). Total RNA was isolated from plants grown at warm temperature, and RNA gel blots were prepared (10 μg) and hybridized with a 32P-labeled probe for RAP2.1.

Similar articles

Cited by

References

    1. Abler, M.L., and Green, P.L. (1996). Control of mRNA stability in higher plants. Plant Mol. Biol. 32, 63–78. - PubMed
    1. Adamska, I. (1997). ELIPs: Light induced stress proteins. Physiol. Plant. 100, 794–805.
    1. Baker, S.S., Wilhelm, K.S., and Thomashow, M.F. (1994). The 5′-region of Arabidopsis thaliana cor15a has cis-acting elements that confer cold-, drought- and ABA-regulated gene expression. Plant Mol. Biol. 24, 701–713. - PubMed
    1. Beator, J., Pötter, E., and Kloppstech, K. (1992). Coordinated circadian regulation of mRNA levels for light-regulated genes and of the capacity for accumulation of chlorophyll protein complexes. Plant Physiol. 100, 1780–1786. - PMC - PubMed
    1. Ciardi, J.A., Deikman, J., and Orzolek, M.D. (1997). Increased ethylene synthesis enhances chilling tolerance in tomato. Physiol. Plant. 101, 333–340.

Publication types

MeSH terms