Comparative Study
. 2002 Aug;14(8):1691-704.
doi: 10.1105/tpc.003079.

Functional rice centromeres are marked by a satellite repeat and a centromere-specific retrotransposon

Affiliations
Comparative Study

Functional rice centromeres are marked by a satellite repeat and a centromere-specific retrotransposon

Zhukuan Cheng et al. Plant Cell. 2002 Aug.

Abstract

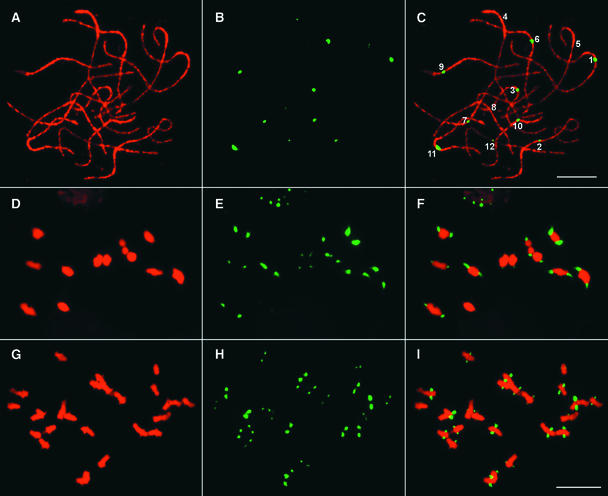
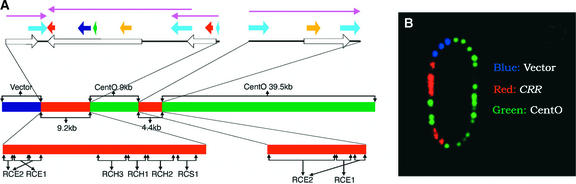
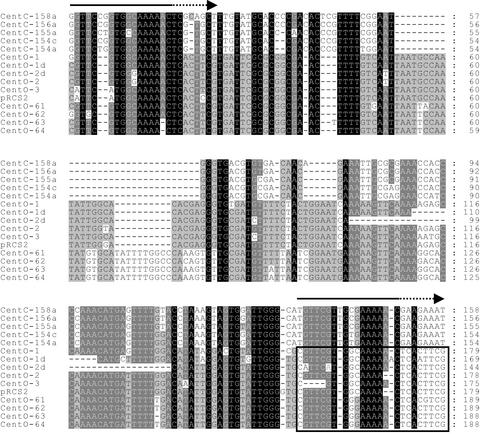
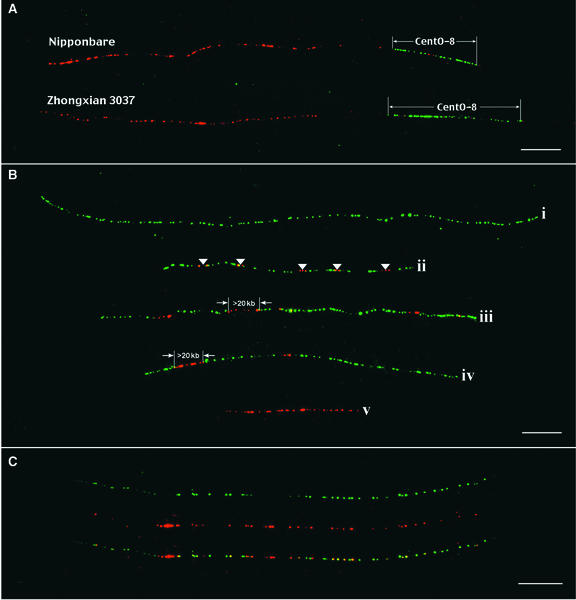
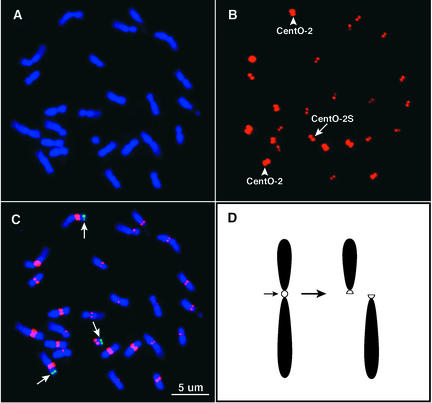
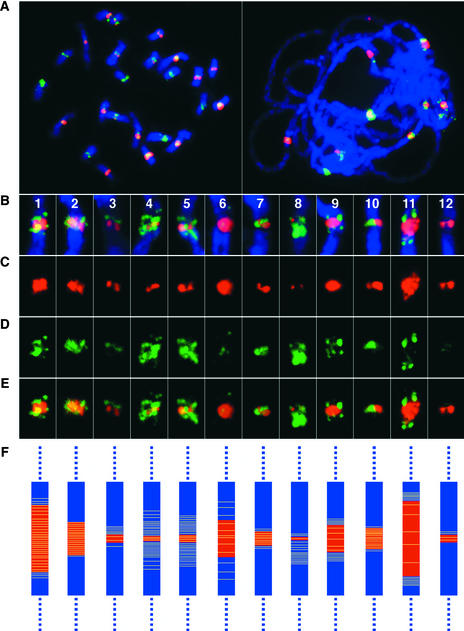
The centromere of eukaryotic chromosomes is essential for the faithful segregation and inheritance of genetic information. In the majority of eukaryotic species, centromeres are associated with highly repetitive DNA, and as a consequence, the boundary for a functional centromere is difficult to define. In this study, we demonstrate that the centers of rice centromeres are occupied by a 155-bp satellite repeat, CentO, and a centromere-specific retrotransposon, CRR. The CentO satellite is located within the chromosomal regions to which the spindle fibers attach. CentO is quantitatively variable among the 12 rice centromeres, ranging from 65 kb to 2 Mb, and is interrupted irregularly by CRR elements. The break points of 14 rice centromere misdivision events were mapped to the middle of the CentO arrays, suggesting that the CentO satellite is located within the functional domain of rice centromeres. Our results demonstrate that the CentO satellite may be a key DNA element for rice centromere function.


Figures

Figure 1.
Figure 1.
Centromeric Localization of the CentO Satellite in Rice. (A) to (C) A single CentO locus is detected on each of the 12 meiotic pachytene chromosomes prepared from var Nipponbare rice. (A) A complete pollen mother cell at the pachytene stage. (B) FISH signals derived from the CentO probe pRCS2. Note that the sizes and intensities of the FISH signals are significantly different among the 12 centromeres. (C) A merged image of the pachytene chromosomes and the FISH signals. The individual pachytene chromosomes are identified based on morphology. Bar = 10 μm. (D) to (F) Locations of the CentO satellite on meiotic metaphase I chromosomes prepared from var Wuyujing 8 rice. (D) A complete pollen mother cell at metaphase I. (E) FISH signals derived from the CentO probe pRCS2. (F) A merged image of the bivalent chromosomes and the FISH signals. Note that the signals are located on the stretched terminal regions on every bivalent chromosome. (G) to (I) Locations of the CentO satellite on mitotic metaphase chromosomes prepared from var Nipponbare rice. (G) A complete somatic cell at metaphase. (H) FISH signals derived from the CentO probe pRCS2. (I) A merged image of the chromosomes and the FISH signals. Note that the signals are located on the stretched chromosomal regions. Bar = 10 μm.
Figure 2.
Figure 2.
Structure of Rice Centromeric BAC 17p22. (A) The middle diagram shows that the insert of BAC 17p22 contains two blocks of the CentO satellite that are 9 and 39.5 kb, respectively, and that are separated by two CRR-related DNA sequences. The top diagram shows the structure of the two CRR-related fragments. The 9.2-kb fragment contains three truncated or rearranged CRR elements. The 4.4-kb fragment contains a single CRR element with two LTRs. Each CRR element is represented by a purple arrow. Open arrows indicate open reading frames; light blue arrows indicate LTRs; the dark blue arrow indicates the reverse transcriptase domain; red arrows indicate the integrase domain; the green arrow indicates the protease domain; yellow arrows indicate the gag domain. The bottom diagram shows that the two CRR-related DNA fragments are covered by six plasmid clones: pRCE1, pRCE2, pRCH1, pRCH2, pRCH3, and pRCS1. These six plasmid clones were used as the CRR probe for FISH analysis. (B) A fiber-FISH image of a single 17p22 molecule visualized by three probes: BAC vector (blue), CRR probe (red), and CentO probe pRCS2 (green). The sequence assembly of BAC 17p22 in (A) is confirmed by the fiber-FISH result.
Figure 3.
Figure 3.
Sequence Similarity between Rice CentO and Maize CentC Centromeric Satellite Repeats. Five CentC monomers (top) are compared with CentO sequences from the 17p22 or pRCS2 clones. CentC contains an internal deletion and a degenerate duplication (CentC numbering is as in the database entry; the degenerate duplications are marked by arrows above). CentC sequences shown are from single, complete monomers, whereas CentO sequences represent single monomers followed by part (∼24 bp) of the adjacent downstream monomer (boxed). The CentO variants displayed include two partial deletions and four members of the 164-bp subfamily. The region removed in the two partial deletions has the maximum predicted potential for bending within the CentO consensus. Sequence conservation between the displayed repeats is indicated by background shading (black represents 100% conservation, dark gray represents at least 80%, and light gray represents at least 60%).
Figure 4.
Figure 4.
Fiber-FISH Analysis of Rice Centromeric DNA. (A) BAC clone RC8-1 (red) is located ∼50 kb away from the CentO locus in rice chromosome 8 (CentO-8). Fiber-FISH signals derived from CentO-8 (green) can be identified unambiguously and measured using RC8-1 as a reference marker. The top signal is from var Nipponbare rice; the bottom signal is from var Zhongxian 3037 rice. Note that the red signals within the CentO-8 loci were derived from the CRR sequences contained in BAC RC8-1. Bar = 10 μm. (B) Representative fiber-FISH signals demonstrate highly variable densities and nesting of the CRR elements (red signals) within CentO arrays (green signals). An ∼400-kb CentO signal (fiber i) contains no CRR insertion. Fiber ii (∼200 kb) shows five insertions (arrowheads). Long CRR signals (>20 kb) inserted into CentO satellite DNA are detected within fibers iii and iv. A CRR signal independent of CentO satellite DNA (fiber v) contains ∼100-kb CRR-related sequences. The long CRR signals most likely are derived from nested CRR elements. Bar = 10 μm. (C) A fiber-FISH signal consists of interspersed signals from CRR and CentO. The top fiber signal (green) is from CentO; the middle fiber signal (red) is from CRR; and the bottom fiber signal is a merged image. Bar = 10 μm.
Figure 5.
Figure 5.
Quantification of the CentO Satellite in the Centromere of Telocentric Chromosome 2S. (A) A complete prometaphase cell of telotrisomic 2S. (B) FISH signals derived from the CentO satellite. The arrow indicates the signal on telocentric chromosome 2S. Arrowheads point to the signals on normal chromosome 2. (C) Merged signals of chromosomes and FISH signals derived from the CentO satellite (red) and BAC clone a0095P12 (green) specific to the short arm of rice chromosome 2 (Cheng et al., 2001a). Note that the FISH signal derived from CentO in the telocentric chromosome is significantly weaker and smaller than those in normal chromosome 2. (D) Diagram of centromere misdivision. A division in the middle of the centromere results in two functional centromeres associated with the two telocentric chromosomes.
Figure 6.
Figure 6.
Distribution and Organization of the CentO Satellite and the Centromere-Specific Retrotransposon CRR in Rice Chromosomes. (A) Localization of the CentO satellite (red) and the CRR elements (green) on mitotic prometaphase chromosomes (left) and meiotic pachytene chromosomes (right). (B) to (E) Images of individual rice centromeres of pachytene chromosomes hybridized with the CentO satellite (red) and the CRR probe (green) (B). The composite images are separated digitally into images of FISH signals derived from the CentO satellite (C), images of FISH signals derived from the CRR probe (D), and merged images of FISH signals from both probes (E). (F) Diagrams depicting the distribution of the CentO satellite (red) and CRR elements (yellow) in individual rice centromeres. The sizes of the red bars represent the relative amount of the CentO satellite (see Table 1). The density of the yellow lines represents the relative density of the CRR elements in different centromeres.

Similar articles

Cited by

References

    1. Alfenito, M.R., and Birchler, J.A. (1993). Molecular characterization of a maize B chromosome centric sequence. Genetics 135, 589–597. - PMC - PubMed
    1. Ananiev, E.V., Phillips, R.L., and Rines, H.W. (1998). Chromosome-specific molecular organization of maize (Zea mays L.) centromeric regions. Proc. Natl. Acad. Sci. USA 95, 13073–13078. - PMC - PubMed
    1. Arabidopsis Genome Initiative. (2000). Analysis of the genome sequence of the flowering plant Arabidopsis thaliana. Nature 408, 796–815. - PubMed
    1. Aragon-Alcaide, L., Miller, T., Schwarzacher, T., Reader, S., and Moore, G. (1996). A cereal centromeric sequence. Chromosoma 105, 261–268. - PubMed
    1. Arumuganathan, K., and Earle, E.D. (1991). Nuclear DNA content of some important plant species. Plant Mol. Biol. Rep. 9, 208–218.

Publication types

Associated data

LinkOut - more resources