. 2002 Aug;14(8):1723-35.
doi: 10.1105/tpc.003293.

Cellular and subcellular localization of phototropin 1

Affiliations

Cellular and subcellular localization of phototropin 1

Koji Sakamoto et al. Plant Cell. 2002 Aug.

Abstract

Phototropin 1 (phot1) is a Ser/Thr photoreceptor kinase that binds two molecules of flavin mononucleotide as its chromophores and undergoes autophosphorylation in response to blue light. Phot1 is plasma membrane associated and, as with phot2, has been shown to function as a photoreceptor for phototropism, blue light-induced chloroplast movement, and blue light-induced stomatal opening. Phot1 likely also plays a redundant role with phot2 in regulating the rate of leaf expansion. Understanding the mechanism(s) by which phot1 initiates these four different responses requires, at minimum, knowledge of where the photoreceptor is located. Therefore, we transformed a phot1 null mutant of Arabidopsis with a construct encoding translationally fused phot1-green fluorescent protein (GFP) under the control of the endogenous PHOT1 promoter and investigated its cellular and subcellular distribution. This PHOT1-GFP construct complements the mutant phenotype, restoring second positive curvature. Phot1 is expressed strongly in dividing and elongating cortical cells in the apical hook and in the root elongation zone in etiolated seedlings. It is localized evenly to the plasma membrane region in epidermal cells but is confined largely to the plasma membrane region of the transverse cell walls in the cortical cells of both root and hypocotyl. It is found at both apical and basal ends of these cortical cells. In light-grown plants, phot1-GFP is localized largely in the plasma membrane regions adjacent to apical and basal cell end walls in the elongating inflorescence stem, where the photoreceptor is expressed strongly in the vascular parenchyma and leaf vein parenchyma. Phot1 also is localized to the plasma membrane region of leaf epidermal cells, mesophyll cells, and guard cells, where its distribution is uniform. Although phot1 is localized consistently to the plasma membrane region in etiolated seedlings, a fraction becomes released to the cytoplasm in response to blue light. Possible relationships between observed phot1 distribution and the various physiological responses activated by blue light are discussed.


Figures

Figure 1.
Figure 1.
Plasmid Construction and Analysis of Transformants. (A) Construction of the gene transfer vector. The start of the genomic PHOT1 DNA from the end of the retrotransposon to the 3′ end of the phot1 structural gene was ligated to the 5′ end of the GFP gene so that the PHOT1 gene was fused translationally with the GFP gene. The 3′ noncoding region between PHOT1 and the downstream mitogen-activated protein kinase kinase (MAPKK) gene was ligated to the 3′ end of the GFP gene. This construct was used to transform the phot1 null mutant nph1-5 (Huala et al., 1997). LB, left border; RB, right border. (B) Immunoblot analysis of phot1 in the wild type and of the phot1-GFP fusion protein in a transformant. Thirty micrograms of whole protein was loaded onto each lane. (C) Comparison of phototropic curvatures of wild-type and null mutant phot1-5 (nph1-5) transformed with the construct encoding the phot1-GFP fusion protein. Curvatures were measured after 24 h of blue light (2 μmol·m−2·s−1). (D) In vitro phosphorylation analysis of membrane protein from wild-type or transformant seedlings. The microsomal fraction was phosphorylated with 32P-ATP in the presence (L) or absence (D) of light. CBB, Coomassie blue–stained gel to show equal protein loading for the phosphorylation assay.
Figure 2.
Figure 2.
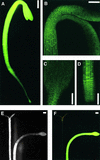
Expression of the phot1-GFP Fusion Protein in 3-Day-Old Etiolated Seedlings. (A) Image of the entire seedling obtained by fluorescence microscopy. (B) Projection confocal image of the hypocotyl hook region. (C) Projection confocal image of the cotyledon. (D) Projection confocal image of the root tip. (E) Phototropic response of the null mutant phot1-5 and the mutant transformed with the PHOT1-GFP construct as seen under white light. (F) Phototropic response of the null mutant phot1-5 and the mutant transformed with the PHOT1-GFP construct as seen under blue light. Bars = 300 μm.
Figure 3.
Figure 3.
Confocal Images of the phot1-GFP Signal in Etiolated Seedlings. (A) Projection image of the apical hook. (B) Single optical section of the hook epidermis. (C) Single optical section of cortical cells. (D) Enlargement of a single optical section of two adjacent cortical cell end walls showing signal from the basal end of the top cell and the apical end of the bottom cell. (E) Single optical section of the root elongation zone. (F) Single optical section showing root cortical (Co) and adjacent epidermal (Ep) cells. Note the weakness of the signal from the epidermal cells and the absence of signal from the cortical cells adjacent to the vascular cylinder. (G) Single optical section of root cortical cells. Note the enhanced signal from the end walls. (H) Single optical section of root epidermal cells. Note the weakness of the signal and the even distribution over all of the walls. Bars = 50 μm.
Figure 4.
Figure 4.
Confocal Images of the phot1-GFP Signal from Various Arabidopsis Organs and Tissues. Chloroplast autofluorescence is indicated in red. Bars = 50 μm. (A) Projection image of confocal images obtained from the leaf epidermis. Note the uniform distribution of signal along all of the epidermal cell walls. (B) Single optical section of mesophyll cells in a transverse section of a leaf. (C) Single optical section of a guard cell pair. Note the signal along all of the walls, including the stomatal pore. (D) Single optical section of a transverse section of the inflorescence stem. Note the signal in the xylem parenchyma and rudimentary cambial regions and in the phloem parenchyma outside of the vascular bundles. (E) Projection confocal image of several optical sections of the xylem parenchyma in a vertical section of the inflorescence stem. Note the bipolar distribution of signal. (F) Single optical section of subepidermal cells of the midvein of a mature leaf. The axis of the vein is vertical in the figure. Note the strong signal from the end walls.
Figure 5.
Figure 5.
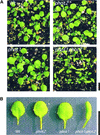
Three-Week-Old Light-Grown Wild-Type and phot Mutant Seedlings of Arabidopsis. (A) Whole seedlings. (B) Individual leaves. Note the curled leaf of the phot1 phot2 double mutant. Wt, wild type. Bars = 1 cm.
Figure 6.
Figure 6.
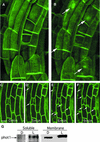
Light-Dependent Dissociation of a Fraction of the phot1-GFP Fusion Protein from the Region of the Plasma Membrane. (A) Projection confocal image of cortical cells in the apical hook of an etiolated seedling. (B) Projection confocal image of the same cells 20 min after the initial scan. The light signal is the laser scan itself. Note the appearance of GFP fluorescence in the cytoplasm (arrows). (C) to (F) Confocal images of single optical sections of epidermal cells from an etiolated seedling scanned every minute, with the images used taken every 3 min. Note the appearance of GFP fluorescence in the cytoplasm (arrows). (G) Immunoblot of the soluble and microsomal fractions of 3-day-old etiolated seedlings before (D) or 1 h after (L) light treatment (100 μmol·m−2·s−1 white light). Bars = 50 μm.
Figure 7.
Figure 7.
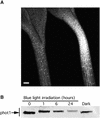
Downregulation of phot1 after Extended Blue Light Treatment (24 h at a Fluence Rate of 20 μmol·m−2·s−1). (A) Projection image of confocal sections of 3-day-old seedlings before (right) and after (left) 24 h of blue light treatment. Bar = 300 μm. (B) Immunoblot analysis of total protein extracted from 3-day-old wild-type seedlings at 0, 3, 6, and 24 h after the onset of the blue light treatment.

Similar articles

Cited by

References

    1. Assmann, S.M., Simoncini, L., and Schroeder, J.I. (1985). Blue light activates electrogenic ion pumping in guard cell protoplasts of Vicia faba. Nature 318, 285–287.
    1. Baum, G., Long, J.C., Jenkins, G.I., and Trewavas, A.J. (1999). Stimulation of the blue light phototropic receptor causes a transient increase in cytosolic Ca2+. Proc. Natl. Acad. Sci. USA 96, 13554–13559. - PMC - PubMed
    1. Becraft, P.W. (1999). Development of the leaf epidermis. Curr. Top. Dev. Biol. 45, 1–40. - PubMed
    1. Bennett, M.J., Marchant, A., Green, H.G., May, S.T., Ward, S.P., Nillner, P.A., Walker, A.R., Schulz, B., and Feldman, K.A. (1996). Arabidopsis AUX1 gene: A permease-like regulator of root gravitropism. Science 273, 948–950. - PubMed
    1. Blum, D.E., Neff, M.M., and Van Volkenburgh, E. (1994). Light-stimulated cotyledon expansion in the blu3 and hy4 mutants of Arabidopsis thaliana. Plant Physiol. 105, 1433–1436. - PMC - PubMed

Publication types

MeSH terms