

A chloroplast phosphate transporter, PHT2;1, influences allocation of phosphate within the plant and phosphate-starvation responses
- PMID: 12172020
- PMCID: PMC151463
- DOI: 10.1105/tpc.002220
A chloroplast phosphate transporter, PHT2;1, influences allocation of phosphate within the plant and phosphate-starvation responses
Abstract
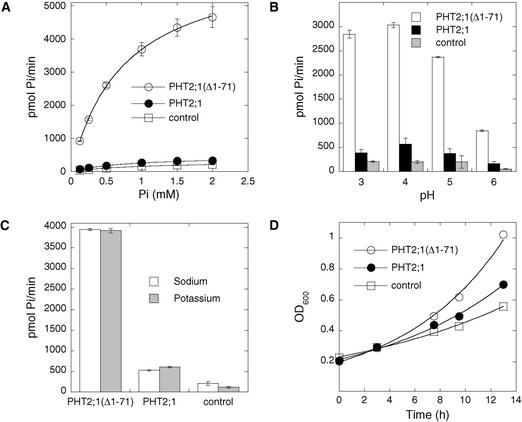
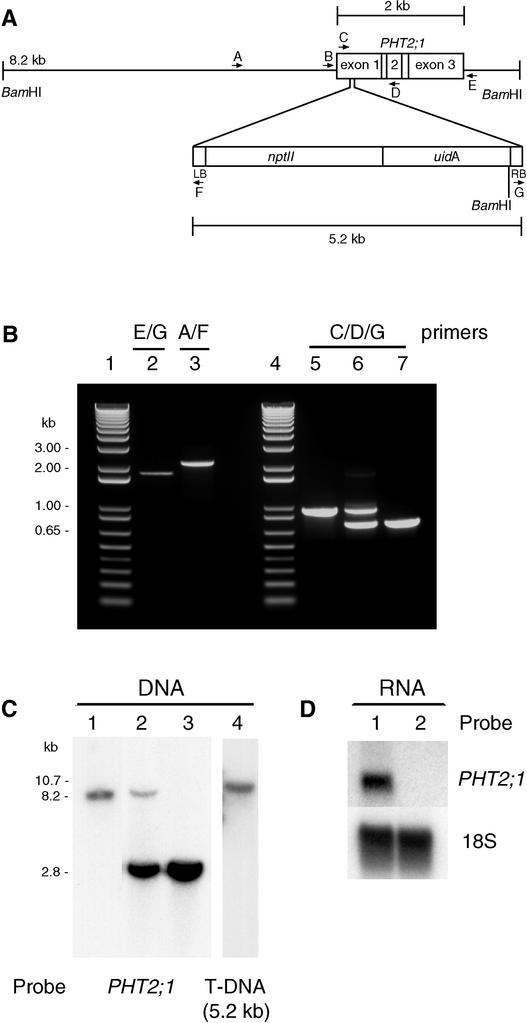
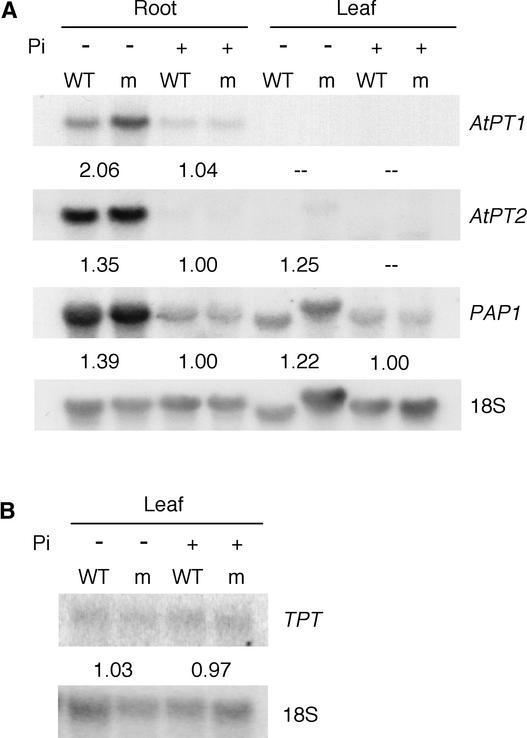
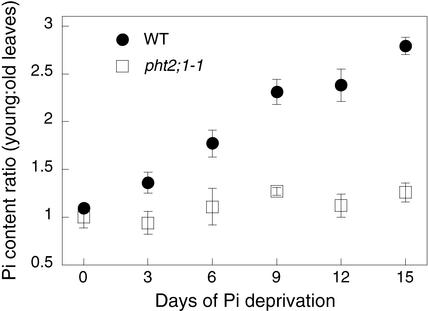
The uptake and distribution of Pi in plants requires multiple Pi transport systems that must function in concert to maintain homeostasis throughout growth and development. The Pi transporter PHT2;1 of Arabidopsis shares similarity with members of the Pi transporter family, which includes Na(+)/Pi symporters of fungal and animal origin and H(+)/Pi symporters of bacterial origin. Sequence comparisons between proteins of this family revealed that plant members possess extended N termini, which share features with chloroplast transit peptides. Localization of a PHT2;1-green fluorescent protein fusion protein indicates that it is present in the chloroplast envelope. A Pi transport function for PHT2;1 was confirmed in yeast using a truncated version of the protein lacking its transit peptide, which allowed targeting to the plasma membrane. To assess the in vivo role of PHT2;1 in phosphorus metabolism, we identified a null mutant, pht2;1-1. Analysis of the mutant reveals that PHT2;1 activity affects Pi allocation within the plant and modulates Pi-starvation responses, including the expression of Pi-starvation response genes and the translocation of Pi within leaves.
Figures


Similar articles
-
Expression analysis suggests novel roles for the plastidic phosphate transporter Pht2;1 in auto- and heterotrophic tissues in potato and Arabidopsis.Plant J. 2004 Jul;39(1):13-28. doi: 10.1111/j.1365-313X.2004.02106.x. Plant J. 2004. PMID: 15200639
-
Function of wheat phosphate transporter gene TaPHT2;1 in Pi translocation and plant growth regulation under replete and limited Pi supply conditions.Planta. 2013 Apr;237(4):1163-78. doi: 10.1007/s00425-012-1836-2. Epub 2013 Jan 12. Planta. 2013. PMID: 23314830
-
A constitutive expressed phosphate transporter, OsPht1;1, modulates phosphate uptake and translocation in phosphate-replete rice.Plant Physiol. 2012 Aug;159(4):1571-81. doi: 10.1104/pp.112.196345. Epub 2012 May 30. Plant Physiol. 2012. PMID: 22649273 Free PMC article.
-
Environmental Control of Phosphorus Acquisition: A Piece of the Molecular Framework Underlying Nutritional Homeostasis.Plant Cell Physiol. 2021 Sep 24;62(4):573-581. doi: 10.1093/pcp/pcab010. Plant Cell Physiol. 2021. PMID: 33508134 Review.
-
The conservation of phosphate-binding residues among PHT1 transporters suggests that distinct transport affinities are unlikely to result from differences in the phosphate-binding site.Biochem Soc Trans. 2016 Oct 15;44(5):1541-1548. doi: 10.1042/BST20160016. Biochem Soc Trans. 2016. PMID: 27911737 Review.
Cited by
-
Phosphate uptake kinetics and tissue-specific transporter expression profiles in poplar (Populus × canescens) at different phosphorus availabilities.BMC Plant Biol. 2016 Sep 23;16(1):206. doi: 10.1186/s12870-016-0892-3. BMC Plant Biol. 2016. PMID: 27663513 Free PMC article.
-
A phosphate transporter from Medicago truncatula is expressed in the photosynthetic tissues of the plant and located in the chloroplast envelope.New Phytol. 2003 Feb;157(2):291-302. doi: 10.1046/j.1469-8137.2003.00677.x. New Phytol. 2003. PMID: 33873646
-
Analysis of the plastidic phosphate translocator gene family in Arabidopsis and identification of new phosphate translocator-homologous transporters, classified by their putative substrate-binding site.Plant Physiol. 2003 Mar;131(3):1178-90. doi: 10.1104/pp.016519. Plant Physiol. 2003. PMID: 12644669 Free PMC article.
-
Disruption of ptLPD1 or ptLPD2, genes that encode isoforms of the plastidial lipoamide dehydrogenase, confers arsenate hypersensitivity in Arabidopsis.Plant Physiol. 2010 Jul;153(3):1385-97. doi: 10.1104/pp.110.153452. Epub 2010 May 20. Plant Physiol. 2010. PMID: 20488895 Free PMC article.
-
Global Survey and Expressions of the Phosphate Transporter Gene Families in Brassica napus and Their Roles in Phosphorus Response.Int J Mol Sci. 2020 Mar 4;21(5):1752. doi: 10.3390/ijms21051752. Int J Mol Sci. 2020. PMID: 32143436 Free PMC article.
References
-
- Altschul, S.F., Gish, W., Miller, W., Myers, E.W., and Lipman, D.J. (1990). Basic local alignment search tool. J. Mol. Biol. 215, 403–410. - PubMed
-
- Ames, B.N. (1966). Assay of inorganic phosphate, total phosphate and phosphatases. Methods Enzymol. 8, 115–118.
-
- Arnon, D.I., and Hoagland, D.R. (1940). Crop production in artificial culture solutions and in soils with special reference to factors influencing yields and absorption of inorganic nutrients. Soil Sci. 50, 463–483.
-
- Bieleski, R.L. (1973). Phosphate pools, phosphate transport and phosphate availability. Annu. Rev. Plant Physiol. 24, 225–252.
Publication types
MeSH terms
Substances
Associated data
- Actions
LinkOut - more resources
Full Text Sources
Other Literature Sources
Molecular Biology Databases
Research Materials
Miscellaneous
