. 2002 Aug;14(8):1903-17.
doi: 10.1105/tpc.002238.

Genome dynamics and evolution of the Mla (powdery mildew) resistance locus in barley

Affiliations

Genome dynamics and evolution of the Mla (powdery mildew) resistance locus in barley

Fusheng Wei et al. Plant Cell. 2002 Aug.

Abstract

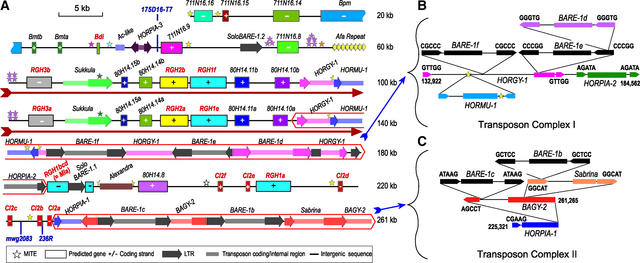
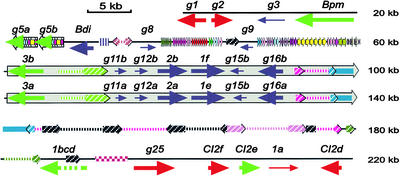
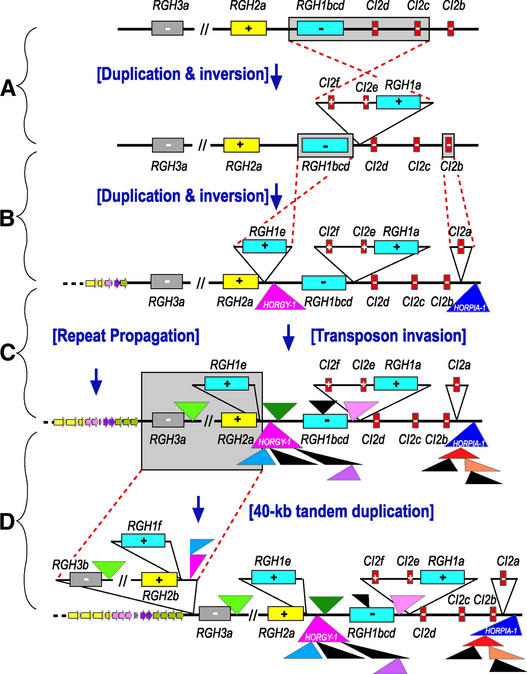
Genes that confer defense against pathogens often are clustered in the genome and evolve via diverse mechanisms. To evaluate the organization and content of a major defense gene complex in cereals, we determined the complete sequence of a 261-kb BAC contig from barley cv Morex that spans the Mla (powdery mildew) resistance locus. Among the 32 predicted genes on this contig, 15 are associated with plant defense responses; 6 of these are associated with defense responses to powdery mildew disease but function in different signaling pathways. The Mla region is organized as three gene-rich islands separated by two nested complexes of transposable elements and a 45-kb gene-poor region. A heterochromatic-like region is positioned directly proximal to Mla and is composed of a gene-poor core with 17 families of diverse tandem repeats that overlap a hypermethylated, but transcriptionally active, gene-dense island. Paleontology analysis of long terminal repeat retrotransposons indicates that the present Mla region evolved over a period of >7 million years through a variety of duplication, inversion, and transposon-insertion events. Sequence-based recombination estimates indicate that R genes positioned adjacent to nested long terminal repeat retrotransposons, such as Mla, do not favor recombination as a means of diversification. We present a model for the evolution of the Mla region that encompasses several emerging features of large cereal genomes.


Figures

Figure 1.
Figure 1.
Sequence Annotation of the Barley Mla Locus from cv Morex. BAC 711N16 (top; 112,178 nucleotides) was sequenced at ×12 redundancy, and BAC 80H14 (bottom; 158,773 nucleotides) was sequenced at ×15 redundancy; sequence error is <1 bp/10 kb. The two BACs are joined by 9686 nucleotides of overlapping sequence encompassing RGH3a and the 5′ end of the Sukkula retrotransposon. The GC content of 261,265 nucleotides of finished sequence is 44.9%, the CpG ratio is 4.2%, the observed/expected CpG ratio is 0.83, and the CpG/GpC ratio is 1.21. These values are consistent with barley genomic contigs encompassing barley Mlo (Panstruga et al., 1998) and Rar1 (Shirasu et al., 2000). + indicates forward strand transcription, and − designates complementary strand transcription. (A) Annotation of the 261,265-nucleotide region. The dark-red text indicates genes associated with defense responses, and the dark-red arrow is below the 40-kb tandem duplication. Different colors show different families of genes or transposable elements. (B) Nested transposon complex I on BAC 80H14 between 132,922 and 184,562 nucleotides. (C) Nested transposon complex II on BAC 80H14 between 225,321 and 261,265 nucleotides. Retrotransposon placement was determined by the 5-bp LTR inverted repeat insertion signature (6-bp direct repeat shown in letters) at the two ends of each element. This direct repeat marks the boundary for each retroelement.
Figure 2.
Figure 2.
Structural Comparison of Morex RGH1 Paralogs with Functional Mla Specificities from Accessions C.I. 16137 (Mla1), C.I. 16151 (Mla6), and C.I. 16155 (Mla13). Deletions in the coding regions are designated by vertical white bars, and insertions are designated by navy blue triangles. Above each vertical white bar or blue triangle is the number of nucleotides for each InDel. InDels that delete an amino acid in the solvent-exposed region are designated with asterisks below the InDel. The number of nucleotides in each exon are shown in brackets. The number of nucleotides in each intron are specified above the intron. The divergence point in the predicted LRR domain of MLA1/MLA6 is marked by an arrow. The BARE-1 LTR in the major intron of RGH1bcd is designated by a solid horizontal line. RGH1e and 1f are both within the 40-kb duplication and differ by one nucleotide but no amino acid change.
Figure 3.
Figure 3.
Tandem Repeats and SSRs in the 45-kb Gene-Poor Region between Nucleotides 20,000 and 65,000 of the Morex Mla Locus. (A) Self-comparison of the sequence by DotPlot analysis. A 2.5-kb tandem duplication (straight lines at bottom left), several satellite DNA sequences (dense dots at center), and a block of nine tandem repeats (dense lines at top right and enlarged region) were identified by this analysis. The angled lines indicate duplication, and the clustering of lines indicates multiple tandem duplications. The interval between two lines shows the size of a single repeat element. The clustering of dots suggests a SSR region. (B) Miropeat analysis illustrates the sequence relationship among repeats. (C) Representation of the position of each repeat element.
Figure 4.
Figure 4.
Methylation and Transcription Analysis of Genes Associated with the Barley Mla Region. Primers, amplification conditions, and a summary of results are provided in Table 4. (A) Different patterns of DNA methylation of genes adjacent to and within the Mla locus. Positive amplification occurs if a particular 5′-C/CGG-3′ site is methylated and cannot be cut by the restriction enzyme. Likewise, amplification cannot occur if the particular 5′-C/CGG-3′ site is not methylated and is digested to completion by the restriction enzyme. (B) RT-PCR analysis of predicted genes adjacent to and within the Mla locus. The templates in each one-step RT-PCR analysis are shown at top. RNA or DNA indicates the use of RNA or genomic DNA as a template for the reaction. In the analysis of each gene, the first lane shows the result of the RT-PCR. The second and the third lanes represent a DNA-free RNA negative control without RT and a positive DNA control, respectively.
Figure 5.
Figure 5.
Overview of Methylation and Transcription Patterns of the Barley Mla Region. Predicted genes are specified by horizontal arrows: unmethylated genes are coded red; methylated genes are coded navy; and partially methylated genes are coded green. Transcribed genes are designated with thick arrows, whereas nontranscribed genes are designated with thin arrows. The gray-filled rectangle (lines 3 and 4) illustrates the 40-kb duplication.
Figure 6.
Figure 6.
Evolution of the Barley Mla Complex. Of the 34 predicted genes in the Mla region, 24 have at least one homolog. The RGH1 and CI2 families represent the major gene duplications in the region and account for 16% of the sequence. The remaining gene duplications have arisen from tandem fragment duplications, of which 14 are located in the 40-kb gene-rich tandem repeat and 2 are located in the 2.6-kb tandem repeat. (A) DNA sequence similarities of RGH1bcd, CI2d, and CI2c compared with RGH1a, CI2f, and CI2e in the opposite orientation indicate an ancient inversion event followed by divergent evolution. (B) A more recent duplication and inversion to create RGH1e is indicated by the higher sequence similarity between RGH1bcd and RGH1e than that between RGH1bcd and RGH1a (Table 1). Similarly, CI2a possesses the highest sequence similarity with CI2b within the CI2 family (Table 2). (C) Within the last 3 million years, extensive transposon insertions in addition to repeat propagation increased the size of the region approximately threefold. (D) A 40-kb tandem duplication of the region containing RGH1e, RGH2a, and RGH3a is the most recent addition to the present-day Mla region. Genes are shown in rectangles with different colors representing different families, and transposable elements are designated by triangles. Designated colors match those in Figures 1 and 3 for each element. + indicates forward strand transcription, and − designates complementary strand transcription.

References

    1. Altschul, S.F., Madden, T.L., Schaffer, A.A., Zhang, J., Zhang, Z., Miller, W., and Lipman, D.J. (1997). Gapped BLAST and PSI-BLAST: A new generation of protein database search programs. Nucleic Acids Res. 25, 3389–3402. - PMC - PubMed
    1. Awadalla, P., and Ritland, K. (1997). Microsatellite variation and evolution in the Mimulus guttatus species complex with contrasting mating systems. Mol. Biol. Evol. 14, 1023–1034. - PubMed
    1. Azevedo, C., Sadanandom, A., Kitagawa, K., Freialdenhoven, A., Shirasu, K., and Schulze-Lefert, P. (2002). The RAR1 interactor SGT1, an essential component of R gene-triggered disease resistance. Science 295, 2073–2076. - PubMed
    1. Baker, B., Zambriski, P., Staskawicz, B., and Dinesh-Kumar, S.P. (1997). Signaling in plant-microbe interactions. Science 276, 726–733. - PubMed
    1. Barakat, A., Carels, N., and Bernardi, G. (1997). The distribution of genes in the genomes of Gramineae. Proc. Natl. Acad. Sci. USA 94, 6857–6861. - PMC - PubMed

Publication types

MeSH terms

Associated data