

ZAS: C2H2 zinc finger proteins involved in growth and development
- PMID: 12173742
- PMCID: PMC5977514
- DOI: 10.3727/000000002783992479
ZAS: C2H2 zinc finger proteins involved in growth and development
Abstract
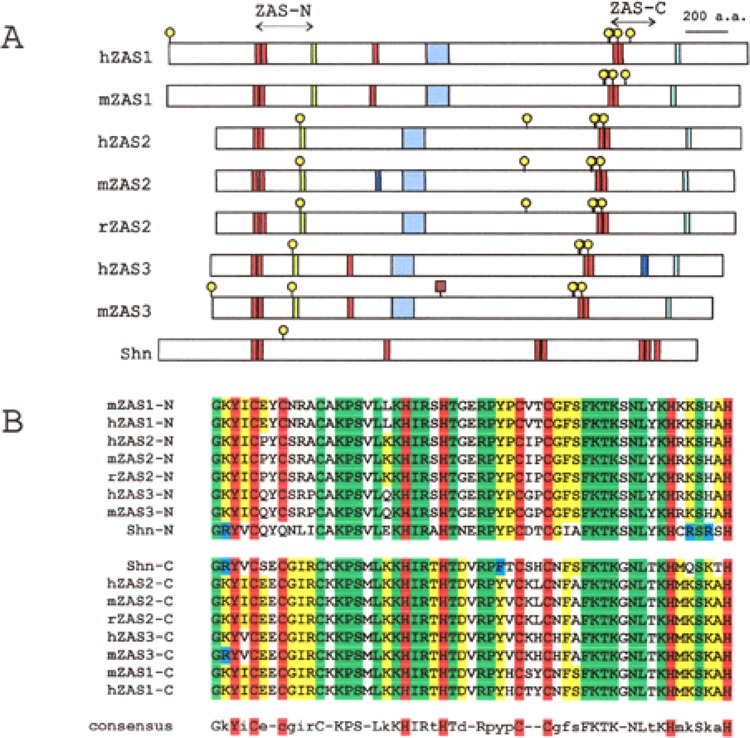
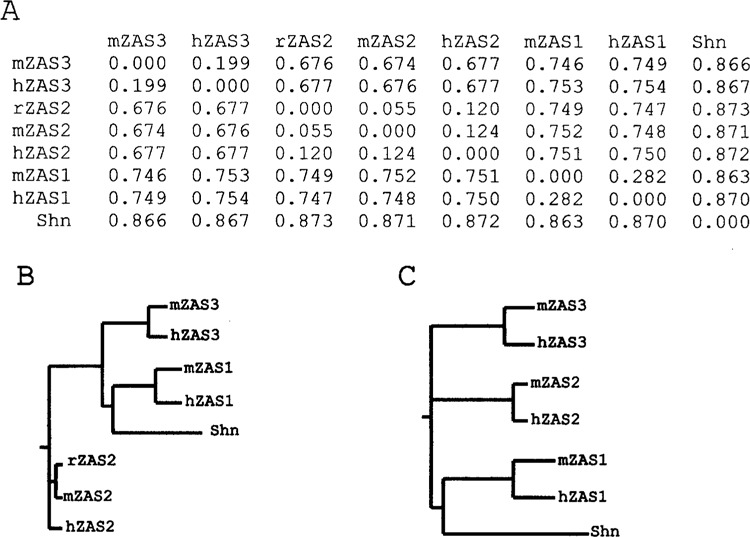
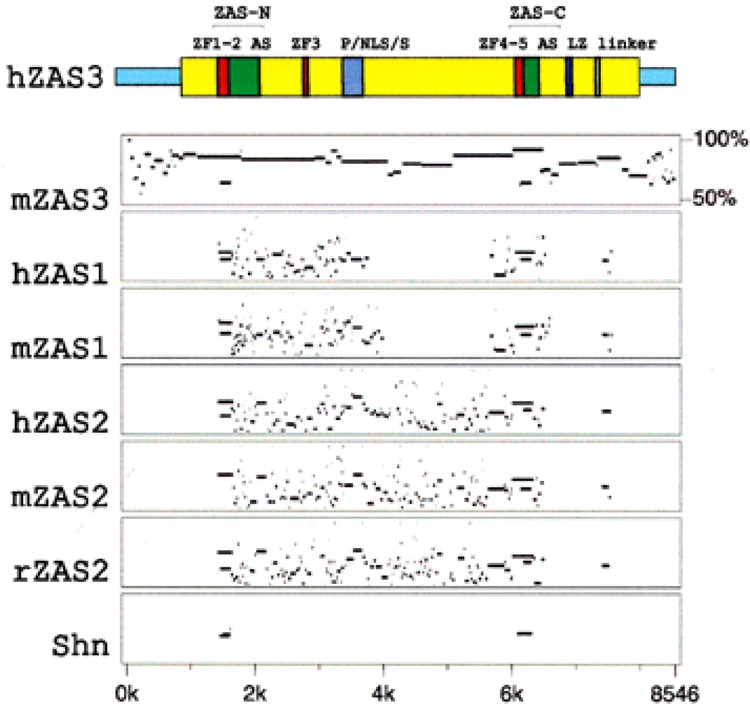
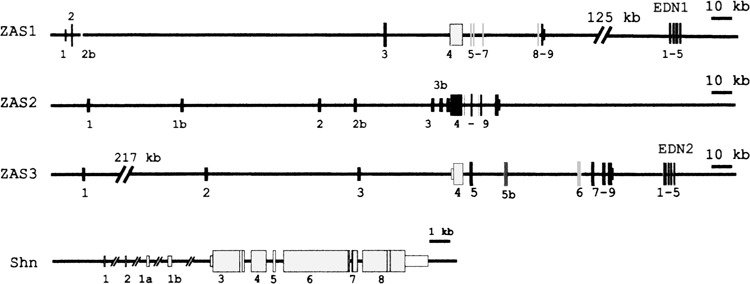
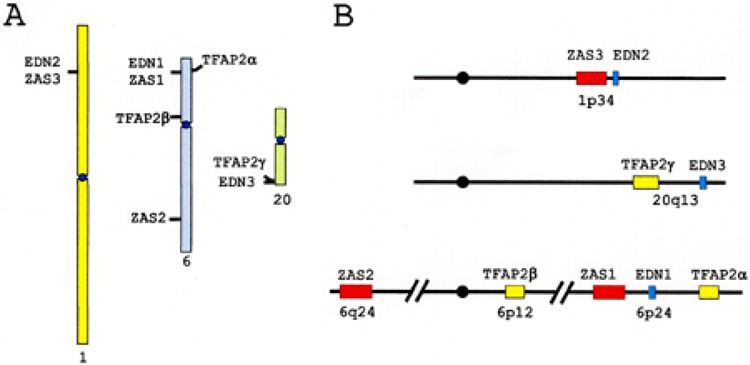
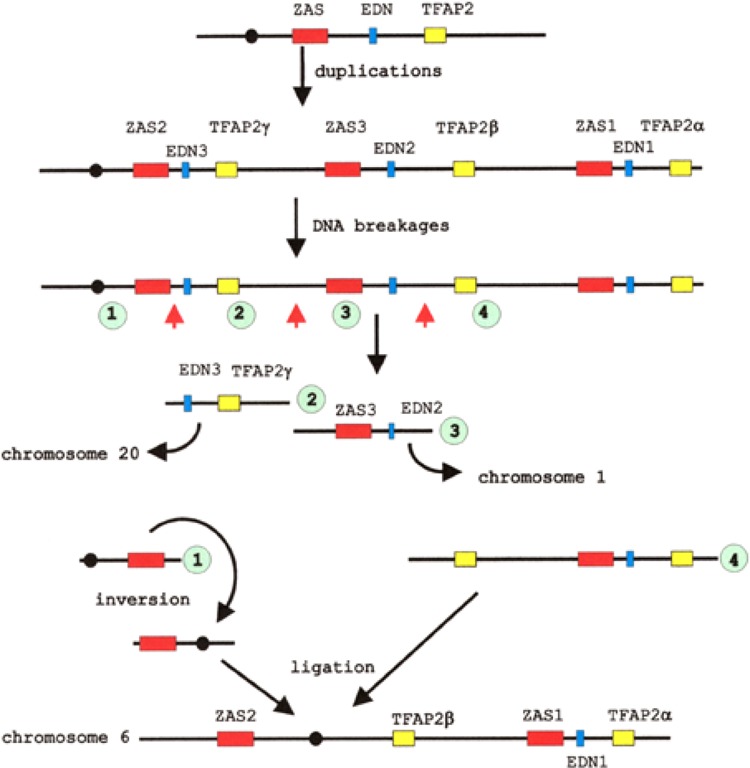
A ZAS gene encodes a large protein with two separate C2H2 zinc finger pairs that independently bind to specific DNA sequences, including the kappaB motif. Three paralogous mammalian genes, ZAS1, ZAS2, and ZAS3, and a related Drosophila gene, Schnurri, have been cloned and characterized. The ZAS genes encode transcriptional proteins that activate or repress the transcription of a variety of genes involved in growth, development, and metastasis. In addition, ZAS3 associates with a TNF receptor-associated factor to inhibit NF-kappaB- and JNK/ SAPK-mediated signaling of TNF-alpha. Genetic experiments show that ZAS3 deficiency leads to proliferation of cells and tumor formation in mice. The data suggest that ZAS3 is important in controlling cell growth, apoptosis, and inflammation. The potent vasoactive hormone endothelin and transcription factor AP2 gene families also each consist of three members. The ZAS, endothelin, and transcription factor AP2 genes form several linkage groups. Knowledge of the chromosomal locations of these genes provides valuable clues to the evolution of the vertebrate genome.
Figures
Similar articles
-
Inhibition of NF-kappaB by ZAS3, a zinc-finger protein that also binds to the kappaB motif.Proc Natl Acad Sci U S A. 2003 Oct 14;100(21):12301-6. doi: 10.1073/pnas.2133048100. Epub 2003 Oct 6. Proc Natl Acad Sci U S A. 2003. PMID: 14530385 Free PMC article.
-
Disruption of ZAS3 in mice alters NF-kappaB and AP-1 DNA binding and T-cell development.Gene Expr. 2007;14(2):83-100. doi: 10.3727/105221607783417574. Gene Expr. 2007. PMID: 18257392 Free PMC article.
-
The large zinc finger protein ZAS3 is a critical modulator of osteoclastogenesis.PLoS One. 2011 Mar 3;6(3):e17161. doi: 10.1371/journal.pone.0017161. PLoS One. 2011. PMID: 21390242 Free PMC article.
-
The snail superfamily of zinc-finger transcription factors.Nat Rev Mol Cell Biol. 2002 Mar;3(3):155-66. doi: 10.1038/nrm757. Nat Rev Mol Cell Biol. 2002. PMID: 11994736 Review.
-
[Structure and function of plant C2H2 zinc finger protein].Yi Chuan. 2004 May;26(3):414-8. Yi Chuan. 2004. PMID: 15640031 Review. Chinese.
Cited by
-
Molecular and Physio-Biochemical Characterization of Cotton Species for Assessing Drought Stress Tolerance.Int J Mol Sci. 2018 Sep 6;19(9):2636. doi: 10.3390/ijms19092636. Int J Mol Sci. 2018. PMID: 30200561 Free PMC article.
-
MicroRNA-181a modulates gene expression of zinc finger family members by directly targeting their coding regions.Nucleic Acids Res. 2010 Nov;38(20):7211-8. doi: 10.1093/nar/gkq564. Epub 2010 Jun 29. Nucleic Acids Res. 2010. PMID: 20591824 Free PMC article.
-
Green transcription factors: a chlamydomonas overview.Genetics. 2008 May;179(1):31-9. doi: 10.1534/genetics.107.086090. Genetics. 2008. PMID: 18493038 Free PMC article.
-
Normalization and analysis of cDNA microarrays using within-array replications applied to neuroblastoma cell response to a cytokine.Proc Natl Acad Sci U S A. 2004 Feb 3;101(5):1135-40. doi: 10.1073/pnas.0307557100. Epub 2004 Jan 22. Proc Natl Acad Sci U S A. 2004. PMID: 14739336 Free PMC article.
-
GsZFP1, a new Cys2/His2-type zinc-finger protein, is a positive regulator of plant tolerance to cold and drought stress.Planta. 2012 Jun;235(6):1141-55. doi: 10.1007/s00425-011-1563-0. Epub 2011 Dec 9. Planta. 2012. PMID: 22160567
References
-
- Aalto Y.; El-Rifa W.; Vilpo L.; Ollila J.; Nagy B.; Vihinen M.; Vilpo J.; Knuutila S. Distinct gene expression profiling in chronic lymphocytic leukemia with 11q23 deletion. Leukemia 15:1721–1728; 2001. - PubMed
-
- Akira S.; Okazaki K.; Sakano H. Two pairs of recombination signals are sufficient to cause immuno-globulin V-(D)-J joining. Science 238:1134–1138; 1987. - PubMed
-
- Allen C. E.; Wu L. C. Downregulation of the large zinc finger protein KRC promotes cell growth, disrupts a cell cycle check point and induces mitotic cell death. Exp. Cell Res. 206:346–356; 2000. - PubMed
-
- Arora K.; Dai H.; Kazuko S. G.; Jamal J.; O’Connor M. B.; Letsou A.; Warrior R. The Drosophila schnurri gene acts in the Dpp/TGF beta signaling pathway and encodes a transcription factor homologous to the human MBP family. Cell 81:781–790; 2002. - PubMed
Publication types
MeSH terms
Substances
LinkOut - more resources
Full Text Sources
Other Literature Sources
Molecular Biology Databases
Research Materials